- 世界
- »
- US
- »
- 喬治亞州
- »
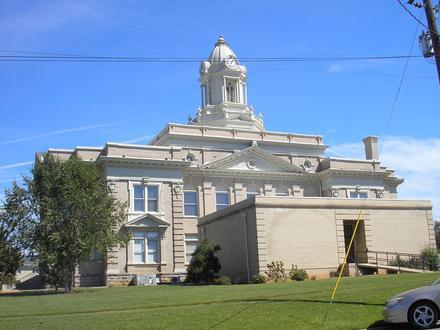
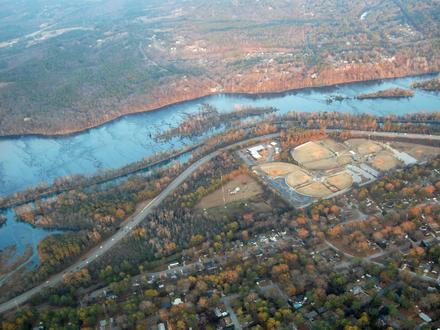
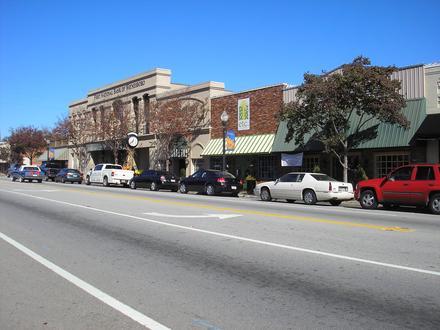
- Wrens, 喬治亞州
在Wrens的企业
产业领域
行业分布 商场: 17.3%
工业: 9.9%
汽车: 8.9%
国内服务: 8.6%
专业服务: 7.9%
金融服务: 7.4%
食品: 6.6%
医疗: 6.5%
餐馆: 6.3%
宗教: 6%
其他: 14.7%
| Wrens, 喬治亞州地区 | 3.05平方英里 |
| 人口 | 2144 |
| 男性人口 | 989 (46.1%) |
| 女性人口 | 1155 (53.9%) |
| 从1975到2015的人口变化 | +202.4% |
| 从2000到2015的人口变化 | -4.1% |
| 年龄中位数 | 39.9 |
| 男性平均年龄 | 36.3 |
| 女性平均年龄 | 42.9 |
| 电话区号 | 706 |
| 邻近社区 | Wrens |
| 本地时间 | 星期日 01:47 |
| 时区 | 北美东部夏令时间 |
| 經度與緯度 | 33.20765° / -82.39179° |
| 邮政编码 | 30833 |
Wrens, 喬治亞州 -地图
Wrens, 喬治亞州人口
1975年到2015年| 数据 | 1975 | 1990 | 2000 | 2015 |
|---|---|---|---|---|
| 人口 | 709 | 1424 | 2236 | 2144 |
| 人口密度 | 232.4 / mi² | 466.9 / mi² | 733.1 / mi² | 702.9 / mi² |
Wrens从2000到2015的人口变化
从2000年到2015年下降4.1%| 位置 | 1975以来的变化 | 1990以来的变化 | 2000以来的变化 |
|---|---|---|---|
| Wrens, 喬治亞州 | +202.4% | +50.6% | -4.1% |
| 喬治亞 | +93.8% | +53.1% | +27.8% |
| 美国 | +46.9% | +27.2% | +13.7% |
Wrens, 喬治亞州平均年龄
平均年龄:39.9年| 位置 | 年龄中位数 | 中位年龄(女) | 中位年龄(男) |
|---|---|---|---|
| Wrens, 喬治亞州 | 39.9年 | 42.9年 | 36.3年 |
| 喬治亞 | 35.4年 | 36.6年 | 34.2年 |
| 美国 | 37.4年 | 38.7年 | 36.1年 |
Wrens, 喬治亞州人口树形图
年龄和性别的人口| 年龄 | 男性 | 女性 | 总 |
|---|---|---|---|
| 5岁以下 | 85 | 68 | 153 |
| 5-9 | 80 | 61 | 142 |
| 10-14 | 74 | 77 | 152 |
| 15-19 | 84 | 75 | 159 |
| 20-24 | 59 | 58 | 117 |
| 25-29 | 51 | 72 | 123 |
| 30-34 | 47 | 70 | 117 |
| 35-39 | 54 | 55 | 109 |
| 40-44 | 45 | 74 | 120 |
| 45-49 | 68 | 67 | 135 |
| 50-54 | 74 | 77 | 151 |
| 55-59 | 60 | 95 | 155 |
| 60-64 | 57 | 87 | 144 |
| 65-69 | 52 | 66 | 118 |
| 70-74 | 41 | 51 | 93 |
| 75-79 | 25 | 38 | 63 |
| 80-84 | 17 | 36 | 54 |
| 85加 | 16 | 30 | 47 |
Wrens, 喬治亞州人口密度
人口密度: 702.9 / mi²| 位置 | 人口 | 面积 | 人口密度 |
|---|---|---|---|
| Wrens, 喬治亞州 | 2144 | 3.05平方英里 | 702.9 / mi² |
| 喬治亞 | 10.5 million | 59,425.5平方英里 | 176.8 / mi² |
| 美国 | 321.6 million | 3,796,761.2平方英里 | 84.7 / mi² |
Wrens, 喬治亞州历史人口
从1820到2015的估计人口Sources:
1. JRC (European Commission's Joint Research Centre) work on the GHS built-up grid
2. CIESIN (Center for International Earth Science Information Network)
3. [链接] Klein Goldewijk, K., Beusen, A., Doelman, J., and Stehfest, E.: Anthropogenic land use estimates for the Holocene – HYDE 3.2, Earth Syst. Sci. Data, 9, 927–953, https://doi.org/10.5194/essd-9-927-2017, 2017.
Wrens, 喬治亞州企业(按价格分布)
不贵: 80.8%
适中: 15.4%
贵: 3.8%
人类发展指数(HDI)
预期寿命,教育程度和人均收入的统计综合指数。Sources: [Link] Kummu, M., Taka, M. & Guillaume, J. Gridded global datasets for Gross Domestic Product and Human Development Index over 1990–2015. Sci Data 5, 180004 (2018) doi:10.1038/sdata.2018.4
Wrens, 喬治亞州二氧化碳排放
每年人均二氧化碳(CO2)排放量(吨)| 位置 | 二氧化碳排放量 | 人均二氧化碳排放量 | 二氧化碳排放强度 |
|---|---|---|---|
| Wrens, 喬治亞州 | 34,725 tn | 16.2 tn | 11,384 tn/mi² |
| 喬治亞 | 183,571,844 tn | 17.5 tn | 3,089 tn/mi² |
| 美国 | 5,664,619,809 tn | 17.6 tn | 1,491 tn/mi² |
Wrens, 喬治亞州二氧化碳排放
| 2013年二氧化碳排放量(吨/年) | 34,725 tn |
| 2013人均二氧化碳排放量(吨/年) | 16.2 tn |
| 2013二氧化碳排放强度(吨/平方英里/年) |
自然灾害风险
相对风险(满分10分)| 气旋 | 平均值(5) |
| 洪水 | 平均值(4) |
| 地震 | 低 (2) |
*风险可能并不涉及整个地区,尤其是洪水或山体滑坡。
Sources: 1. Dilley, M., R.S. Chen, U. Deichmann, A.L. Lerner-Lam, M. Arnold, J. Agwe, P. Buys, O. Kjekstad, B. Lyon, and G. Yetman. 2005. Natural Disaster Hotspots: A Global Risk Analysis. Washington, D.C.: World Bank. https://doi.org/10.1596/0-8213-5930-4.
2. Center for Hazards and Risk Research - CHRR - Columbia University, Center for International Earth Science Information Network - CIESIN - Columbia University. 2005. Global Earthquake Hazard Distribution - Peak Ground Acceleration. Palisades, NY: NASA Socioeconomic Data and Applications Center (SEDAC). https://doi.org/10.7927/H4BZ63ZS.
3. Center for Hazards and Risk Research - CHRR - Columbia University, Center for International Earth Science Information Network - CIESIN - Columbia University, International Bank for Reconstruction and Development - The World Bank, and United Nations Environment Programme Global Resource Information Database Geneva - UNEP/GRID-Geneva. 2005. Global Cyclone Hazard Frequency and Distribution. Palisades, NY: NASA Socioeconomic Data and Applications Center (SEDAC). https://doi.org/10.7927/H4CZ353K.
4. Center for Hazards and Risk Research - CHRR - Columbia University, Center for International Earth Science Information Network - CIESIN - Columbia University. 2005. Global Flood Hazard Frequency and Distribution. Palisades, NY: NASA Socioeconomic Data and Applications Center (SEDAC). https://doi.org/10.7927/H4668B3D.
最近的附近地震
幅度3.0以上| 日期 | 时间 | 大小 | 距离 | 深度 | 位置 | 链接 |
|---|---|---|---|---|---|---|
| 2017/6/20 | 08:14 | 3.2 | 42.6公里 | 12,930米 | 6km SW of Augusta, Georgia | usgs.gov |
| 2014/2/14 | 19:23 | 4.1 | 73.1公里 | 5,180米 | 15km WNW of Edgefield, South Carolina | usgs.gov |
| 2009/12/6 | 16:27 | 3.2 | 61.1公里 | 6,870米 | 19km WNW of Sandersville, Georgia | usgs.gov |
| 2009/4/4 | 13:45 | 3.1 | 75.6公里 | None | 15km N of Milledgeville, Georgia | usgs.gov |
| 2003/7/13 | 13:15 | 3.6 | 99.5公里 | 5,000米 | Georgia, USA | usgs.gov |
| 2003/3/17 | 22:04 | 3.5 | 70.6公里 | 5,000米 | Georgia, USA | usgs.gov |
| 2000/1/18 | 14:19 | 3.5 | 80.4公里 | 5,000米 | Georgia, USA | usgs.gov |
| 1993/8/8 | 02:24 | 3.2 | 87.8公里 | 5,000米 | South Carolina | usgs.gov |
| 1992/1/2 | 20:21 | 3.2 | 82.2公里 | 5,000米 | Georgia, USA | usgs.gov |
| 1974/12/3 | 00:25 | 3.6 | 82.9公里 | None | Georgia, USA | usgs.gov |
查找Wrens, 喬治亞州附近的历史地震事件
最早日期 最新日期
幅度3.0以上 幅度4.0及更高 震级5.0以上
关于我们的数据
此页面上的数据是使用许多公共可用工具和资源估算的。它不提供任何保修,并且可能包含不正确的地方。使用风险自负。有关更多信息,请参见此处 。