- 世界
- »
- US
- »
- 康乃狄克州
- »
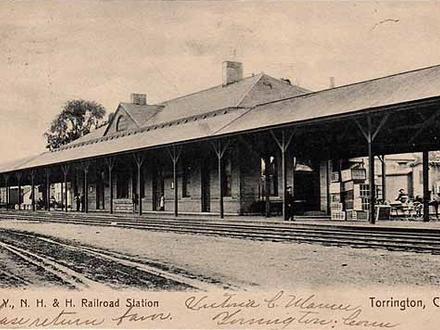
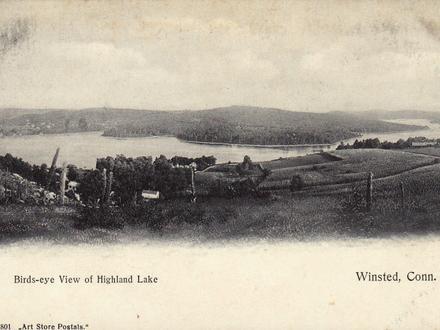
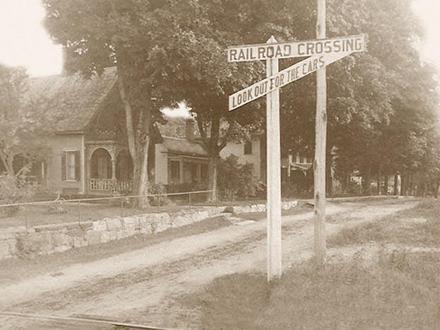
- Winsted, 康乃狄克州
在Winsted的企业
产业领域
行业分布 商场: 17.3%
工业: 13.3%
专业服务: 11.3%
国内服务: 10.7%
医疗: 8.4%
餐馆: 5.9%
汽车: 5.7%
其他: 27.4%
| 行业说明 | 机构数 | 平均营业年龄 | Google平均评分 | 每千名居民的业务 |
|---|---|---|---|---|
| 加油站 | 10 | 27.9年 | 3.9 | 1.3 |
| 汽车维修 | 23 | 34年 | 4.5 | 3.0 |
| 理发师 | 9 | 25年 | 4.7 | 1.2 |
| 美容院 | 11 | 28年 | 4.7 | 1.4 |
| 公共管理 | 37 | 70.5年 | 2.8 | 4.9 |
| 社会工作 | 10 | 31.9年 | 4.5 | 1.3 |
| 自动取款机 | 15 | 4.1 | 2.0 | |
| 金融 - 其他 | 11 | 81.7年 | 4.4 | 1.4 |
| 银行 | 14 | 71.3年 | 2.7 | 1.8 |
| 杂货店和超市 | 8 | 30.2年 | 4.5 | 1.0 |
| 一般承包商 | 53 | 30.5年 | 4.0 | 7.0 |
| 其他建筑 | 15 | 28年 | 5.0 | 2.0 |
| 园林绿化 | 14 | 27.5年 | 4.5 | 1.8 |
| 房地产 | 17 | 40.3年 | 4.2 | 2.2 |
| 电气安装 | 8 | 38.2年 | 5.0 | 1.0 |
| 其他会员组织 | 12 | 69.2年 | 4.3 | 1.6 |
| 建筑材料批发 | 10 | 39.9年 | 4.0 | 1.3 |
| 批发商 | 11 | 32.2年 | 5.0 | 1.4 |
| 机械设备批发 | 13 | 32.4年 | 4.0 | 1.7 |
| 楼宇的建筑 | 24 | 28.9年 | 3.2 | 3.1 |
| 车辆和机械设备生产 | 12 | 50年 | 5.0 | 1.6 |
| 墓地和火葬场 | 10 | 103.5年 | 5.0 | 1.3 |
| 健康和医疗 | 71 | 38年 | 4.4 | 9.3 |
| 内科医生与外科医生 | 27 | 30.5年 | 4.4 | 3.5 |
| 牙科医生 | 12 | 40.7年 | 5.0 | 1.6 |
| 企业管理 | 12 | 28.7年 | 2.6 | 1.6 |
| 会计 | 11 | 40.7年 | 4.5 | 1.4 |
| 律师 | 21 | 38.2年 | 4.2 | 2.8 |
| 技术架构服务 | 8 | 26.2年 | 3.5 | 1.0 |
| 科学和技术服务 | 12 | 30.1年 | 5.0 | 1.6 |
| 教堂 | 11 | 48.1年 | 4.8 | 1.4 |
| 五金店 | 11 | 41.2年 | 4.5 | 1.4 |
| 公园 | 13 | 4.3 | 1.7 |
| Winsted, 康乃狄克州地区 | 4.826平方英里 |
| 人口 | 7624 |
| 男性人口 | 3700 (48.5%) |
| 女性人口 | 3924 (51.5%) |
| 从1975到2015的人口变化 | +16.9% |
| 从2000到2015的人口变化 | +4.8% |
| 年龄中位数 | 41.9 |
| 男性平均年龄 | 40.5 |
| 女性平均年龄 | 43.2 |
| 电话区号 | 860 |
| 邻近社区 | Winsted |
| 本地时间 | 星期日 01:48 |
| 时区 | 北美东部夏令时间 |
| 經度與緯度 | 41.92121° / -73.06011° |
| 邮政编码 | 06098 |
Winsted, 康乃狄克州 -地图
Winsted, 康乃狄克州人口
1975年到2015年| 数据 | 1975 | 1990 | 2000 | 2015 |
|---|---|---|---|---|
| 人口 | 6524 | 6777 | 7275 | 7624 |
| 人口密度 | 1351 / mi² | 1404 / mi² | 1507 / mi² | 1579 / mi² |
Winsted从2000到2015的人口变化
从2000年到2015年增长4.8%| 位置 | 1975以来的变化 | 1990以来的变化 | 2000以来的变化 |
|---|---|---|---|
| Winsted, 康乃狄克州 | +16.9% | +12.5% | +4.8% |
| 康乃狄克州 | +28.8% | +14.7% | +5.9% |
| 美国 | +46.9% | +27.2% | +13.7% |
Winsted, 康乃狄克州平均年龄
平均年龄:41.9年| 位置 | 年龄中位数 | 中位年龄(女) | 中位年龄(男) |
|---|---|---|---|
| Winsted, 康乃狄克州 | 41.9年 | 43.2年 | 40.5年 |
| 康乃狄克州 | 40.1年 | 41.6年 | 38.6年 |
| 美国 | 37.4年 | 38.7年 | 36.1年 |
Winsted, 康乃狄克州人口树形图
年龄和性别的人口| 年龄 | 男性 | 女性 | 总 |
|---|---|---|---|
| 5岁以下 | 213 | 212 | 426 |
| 5-9 | 229 | 214 | 444 |
| 10-14 | 243 | 229 | 472 |
| 15-19 | 221 | 242 | 463 |
| 20-24 | 244 | 227 | 471 |
| 25-29 | 245 | 244 | 489 |
| 30-34 | 205 | 215 | 421 |
| 35-39 | 225 | 216 | 441 |
| 40-44 | 259 | 261 | 520 |
| 45-49 | 348 | 325 | 673 |
| 50-54 | 296 | 317 | 613 |
| 55-59 | 273 | 287 | 560 |
| 60-64 | 249 | 224 | 473 |
| 65-69 | 123 | 180 | 304 |
| 70-74 | 107 | 148 | 256 |
| 75-79 | 95 | 110 | 206 |
| 80-84 | 60 | 131 | 192 |
| 85加 | 66 | 144 | 210 |
Winsted, 康乃狄克州人口密度
人口密度: 1579 / mi²| 位置 | 人口 | 面积 | 人口密度 |
|---|---|---|---|
| Winsted, 康乃狄克州 | 7624 | 4.826平方英里 | 1579 / mi² |
| 康乃狄克州 | 3.6 million | 5,543.6平方英里 | 654.0 / mi² |
| 美国 | 321.6 million | 3,796,761.2平方英里 | 84.7 / mi² |
Winsted, 康乃狄克州的预计人口
从1975到2100的估计人口Sources:
1. JRC (European Commission's Joint Research Centre) work on the GHS built-up grid
2. CIESIN (Center for International Earth Science Information Network)
3. [链接] Klein Goldewijk, K., Beusen, A., Doelman, J., and Stehfest, E.: Anthropogenic land use estimates for the Holocene – HYDE 3.2, Earth Syst. Sci. Data, 9, 927–953, https://doi.org/10.5194/essd-9-927-2017, 2017.
Winsted, 康乃狄克州企业(按价格分布)
适中: 50.7%
不贵: 42.3%
贵: 5.6%
非常贵: 1.4%
人类发展指数(HDI)
预期寿命,教育程度和人均收入的统计综合指数。Sources: [Link] Kummu, M., Taka, M. & Guillaume, J. Gridded global datasets for Gross Domestic Product and Human Development Index over 1990–2015. Sci Data 5, 180004 (2018) doi:10.1038/sdata.2018.4
Winsted, 康乃狄克州二氧化碳排放
每年人均二氧化碳(CO2)排放量(吨)| 位置 | 二氧化碳排放量 | 人均二氧化碳排放量 | 二氧化碳排放强度 |
|---|---|---|---|
| Winsted, 康乃狄克州 | 152,810 tn | 20 tn | 31,661 tn/mi² |
| 康乃狄克州 | 65,866,799 tn | 18.2 tn | 11,881 tn/mi² |
| 美国 | 5,664,619,809 tn | 17.6 tn | 1,491 tn/mi² |
Winsted, 康乃狄克州二氧化碳排放
| 2013年二氧化碳排放量(吨/年) | 152,810 tn |
| 2013人均二氧化碳排放量(吨/年) | 20 tn |
| 2013二氧化碳排放强度(吨/平方英里/年) |
自然灾害风险
相对风险(满分10分)| 气旋 | 高(7) |
| 洪水 | 高(7) |
| 地震 | 低 (2) |
*风险可能并不涉及整个地区,尤其是洪水或山体滑坡。
Sources: 1. Dilley, M., R.S. Chen, U. Deichmann, A.L. Lerner-Lam, M. Arnold, J. Agwe, P. Buys, O. Kjekstad, B. Lyon, and G. Yetman. 2005. Natural Disaster Hotspots: A Global Risk Analysis. Washington, D.C.: World Bank. https://doi.org/10.1596/0-8213-5930-4.
2. Center for Hazards and Risk Research - CHRR - Columbia University, Center for International Earth Science Information Network - CIESIN - Columbia University. 2005. Global Earthquake Hazard Distribution - Peak Ground Acceleration. Palisades, NY: NASA Socioeconomic Data and Applications Center (SEDAC). https://doi.org/10.7927/H4BZ63ZS.
3. Center for Hazards and Risk Research - CHRR - Columbia University, Center for International Earth Science Information Network - CIESIN - Columbia University, International Bank for Reconstruction and Development - The World Bank, and United Nations Environment Programme Global Resource Information Database Geneva - UNEP/GRID-Geneva. 2005. Global Cyclone Hazard Frequency and Distribution. Palisades, NY: NASA Socioeconomic Data and Applications Center (SEDAC). https://doi.org/10.7927/H4CZ353K.
4. Center for Hazards and Risk Research - CHRR - Columbia University, Center for International Earth Science Information Network - CIESIN - Columbia University. 2005. Global Flood Hazard Frequency and Distribution. Palisades, NY: NASA Socioeconomic Data and Applications Center (SEDAC). https://doi.org/10.7927/H4668B3D.
最近的附近地震
幅度3.0以上| 日期 | 时间 | 大小 | 距离 | 深度 | 位置 | 链接 |
|---|---|---|---|---|---|---|
| 2015/1/12 | 03:36 | 3.3 | 98.1公里 | 5,400米 | 0km NE of Wauregan, Connecticut | usgs.gov |
| 2000/6/15 | 21:02 | 3.3 | 28.1公里 | 9,800米 | southern New England | usgs.gov |
| 1994/10/2 | 07:36 | 3.3 | 85公里 | 10,000米 | southern New England | usgs.gov |
| 1994/10/2 | 04:27 | 3.7 | 80.2公里 | 10,000米 | southern New England | usgs.gov |
| 1981/10/21 | 09:49 | 3.8 | 94.6公里 | 5,600米 | southern New England | usgs.gov |
| 1980/10/24 | 10:27 | 3.1 | 69.9公里 | None | southern New England | usgs.gov |
| 1974/6/7 | 12:45 | 3.3 | 82.9公里 | 2,000米 | New York | usgs.gov |

关于我们的数据
此页面上的数据是使用许多公共可用工具和资源估算的。它不提供任何保修,并且可能包含不正确的地方。使用风险自负。有关更多信息,请参见此处 。