- 世界
- »
- US
- »
- 俄勒冈州
- »
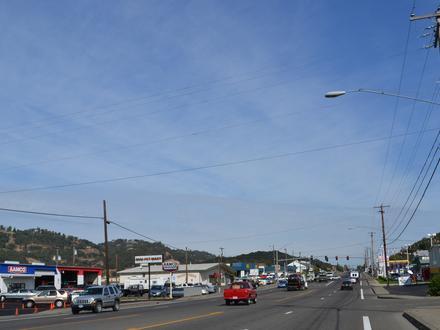
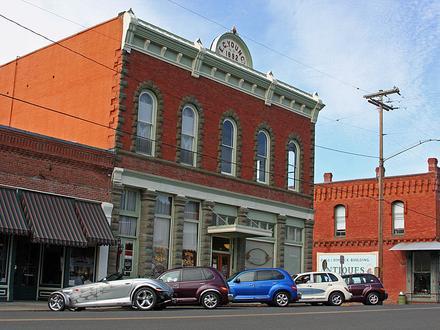
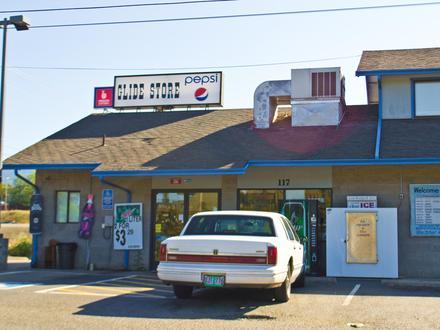
- Sutherlin, 俄勒冈州
在Sutherlin的企业
产业领域
行业分布 商场: 15.2%
工业: 11.5%
国内服务: 10.9%
汽车: 9.7%
专业服务: 8.3%
餐馆: 7.8%
医疗: 5%
本地服务: 4.9%
其他: 26.5%
| 行业说明 | 机构数 | 平均营业年龄 | Google平均评分 | 每千名居民的业务 |
|---|---|---|---|---|
| 加油站 | 9 | 3.9 | 1.1 | |
| 新车经销商 | 6 | 32.5年 | 4.3 | 0.8 |
| 汽车维修 | 21 | 33.3年 | 4.3 | 2.7 |
| 汽车部件 | 7 | 26.8年 | 4.4 | 0.9 |
| 煞车、消音器和变速器 | 5 | 47.7年 | 4.3 | 0.6 |
| 理发师 | 9 | 25.3年 | 4.3 | 1.1 |
| 美容院 | 8 | 25.1年 | 4.3 | 1.0 |
| 公共管理 | 11 | 30年 | 4.0 | 1.4 |
| 中小学 | 5 | 0.6 | ||
| 自动取款机 | 9 | 2.8 | 1.1 | |
| 金融 - 其他 | 5 | 0.6 | ||
| 银行 | 12 | 3.2 | 1.5 | |
| 便利店 | 6 | 47年 | 3.7 | 0.8 |
| 杂货店和超市 | 11 | 44.4年 | 4.0 | 1.4 |
| 一般承包商 | 32 | 27.5年 | 4.6 | 4.1 |
| 其他建筑 | 11 | 30.9年 | 1.4 | |
| 房地产 | 13 | 28年 | 3.9 | 1.7 |
| 搬家公司 | 8 | 35.4年 | 5.0 | 1.0 |
| 电气安装 | 7 | 26.9年 | 5.0 | 0.9 |
| 其他住宿 | 9 | 32.1年 | 4.3 | 1.1 |
| 酒店旅馆 | 6 | 33.3年 | 4.3 | 0.8 |
| 储存和入库 | 7 | 31.3年 | 4.6 | 0.9 |
| 其他会员组织 | 6 | 30.7年 | 4.5 | 0.8 |
| 建筑材料批发 | 6 | 38.7年 | 5.0 | 0.8 |
| 楼宇的建筑 | 18 | 30年 | 4.6 | 2.3 |
| 矿物和金属产品生产 | 6 | 28.3年 | 4.1 | 0.8 |
| 货运/商业运输 | 11 | 31.2年 | 4.4 | 1.4 |
| 地毯清洗 | 5 | 29.7年 | 4.8 | 0.6 |
| 墓地和火葬场 | 5 | 21.1年 | 0.6 | |
| 洗衣店 | 7 | 29.7年 | 4.1 | 0.9 |
| 自助式仓储 | 7 | 31.3年 | 4.6 | 0.9 |
| 健康和医疗 | 9 | 3.2 | 1.1 | |
| 牙科医生 | 9 | 36.1年 | 4.3 | 1.1 |
| 宠物美容和寄宿 | 5 | 4.6 | 0.6 | |
| 企业管理 | 8 | 26.9年 | 1.5 | 1.0 |
| 会计 | 7 | 34.7年 | 5.0 | 0.9 |
| 教堂 | 19 | 58.9年 | 4.8 | 2.4 |
| 咖啡 | 5 | 4.6 | 0.6 | |
| 快餐店 | 5 | 54.9年 | 3.6 | 0.6 |
| 美国餐馆 | 7 | 17.9年 | 4.1 | 0.9 |
| 五金店 | 6 | 37.9年 | 3.8 | 0.8 |
| 家用电器和物品 | 7 | 4.7 | 0.9 | |
| 药房和药店 | 5 | 4.4 | 0.6 | |
| 购物 - 其他 | 5 | 46.3年 | 4.3 | 0.6 |
| 公园 | 6 | 4.3 | 0.8 |
| Sutherlin, 俄勒冈州地区 | 6.35平方英里 |
| 人口 | 7860 |
| 男性人口 | 3762 (47.9%) |
| 女性人口 | 4098 (52.1%) |
| 从1975到2015的人口变化 | +93.5% |
| 从2000到2015的人口变化 | +9.4% |
| 年龄中位数 | 43.1 |
| 男性平均年龄 | 41.3 |
| 女性平均年龄 | 44.7 |
| 电话区号 | 541 |
| 邻近社区 | Sutherlin |
| 本地时间 | 星期六 22:59 |
| 时区 | 北美太平洋夏令时间 |
| 經度與緯度 | 43.39012° / -123.31258° |
| 邮政编码 | 97479 |
Sutherlin, 俄勒冈州 -地图
Sutherlin, 俄勒冈州人口
1975年到2015年| 数据 | 1975 | 1990 | 2000 | 2015 |
|---|---|---|---|---|
| 人口 | 4063 | 5436 | 7185 | 7860 |
| 人口密度 | 639.7 / mi² | 855.9 / mi² | 1131 / mi² | 1237 / mi² |
Sutherlin从2000到2015的人口变化
从2000年到2015年增长9.4%| 位置 | 1975以来的变化 | 1990以来的变化 | 2000以来的变化 |
|---|---|---|---|
| Sutherlin, 俄勒冈州 | +93.5% | +44.6% | +9.4% |
| 俄勒冈州 | +65% | +34.6% | +16.8% |
| 美国 | +46.9% | +27.2% | +13.7% |
Sutherlin, 俄勒冈州平均年龄
平均年龄:43.1年| 位置 | 年龄中位数 | 中位年龄(女) | 中位年龄(男) |
|---|---|---|---|
| Sutherlin, 俄勒冈州 | 43.1年 | 44.7年 | 41.3年 |
| 俄勒冈州 | 38.5年 | 39.6年 | 37.3年 |
| 美国 | 37.4年 | 38.7年 | 36.1年 |
Sutherlin, 俄勒冈州人口树形图
年龄和性别的人口| 年龄 | 男性 | 女性 | 总 |
|---|---|---|---|
| 5岁以下 | 255 | 250 | 505 |
| 5-9 | 226 | 246 | 473 |
| 10-14 | 259 | 266 | 525 |
| 15-19 | 288 | 223 | 511 |
| 20-24 | 180 | 186 | 367 |
| 25-29 | 196 | 229 | 426 |
| 30-34 | 218 | 225 | 444 |
| 35-39 | 201 | 216 | 417 |
| 40-44 | 225 | 221 | 447 |
| 45-49 | 226 | 253 | 479 |
| 50-54 | 225 | 263 | 488 |
| 55-59 | 286 | 271 | 558 |
| 60-64 | 225 | 279 | 505 |
| 65-69 | 210 | 231 | 441 |
| 70-74 | 168 | 218 | 386 |
| 75-79 | 155 | 195 | 350 |
| 80-84 | 127 | 173 | 300 |
| 85加 | 92 | 153 | 246 |
Sutherlin, 俄勒冈州人口密度
人口密度: 1237 / mi²| 位置 | 人口 | 面积 | 人口密度 |
|---|---|---|---|
| Sutherlin, 俄勒冈州 | 7860 | 6.35平方英里 | 1237 / mi² |
| 俄勒冈州 | 4.0 million | 98,379.3平方英里 | 40.8 / mi² |
| 美国 | 321.6 million | 3,796,761.2平方英里 | 84.7 / mi² |
Sutherlin, 俄勒冈州的历史和预计人口
从1870到2100的估计人口Sources:
1. JRC (European Commission's Joint Research Centre) work on the GHS built-up grid
2. CIESIN (Center for International Earth Science Information Network)
3. [链接] Klein Goldewijk, K., Beusen, A., Doelman, J., and Stehfest, E.: Anthropogenic land use estimates for the Holocene – HYDE 3.2, Earth Syst. Sci. Data, 9, 927–953, https://doi.org/10.5194/essd-9-927-2017, 2017.
Sutherlin, 俄勒冈州企业(按价格分布)
适中: 49.2%
不贵: 44.4%
贵: 6.3%
人类发展指数(HDI)
预期寿命,教育程度和人均收入的统计综合指数。Sources: [Link] Kummu, M., Taka, M. & Guillaume, J. Gridded global datasets for Gross Domestic Product and Human Development Index over 1990–2015. Sci Data 5, 180004 (2018) doi:10.1038/sdata.2018.4
Sutherlin, 俄勒冈州二氧化碳排放
每年人均二氧化碳(CO2)排放量(吨)| 位置 | 二氧化碳排放量 | 人均二氧化碳排放量 | 二氧化碳排放强度 |
|---|---|---|---|
| Sutherlin, 俄勒冈州 | 124,482 tn | 15.8 tn | 19,599 tn/mi² |
| 俄勒冈州 | 70,678,562 tn | 17.6 tn | 718.4 tn/mi² |
| 美国 | 5,664,619,809 tn | 17.6 tn | 1,491 tn/mi² |
Sutherlin, 俄勒冈州二氧化碳排放
| 2013年二氧化碳排放量(吨/年) | 124,482 tn |
| 2013人均二氧化碳排放量(吨/年) | 15.8 tn |
| 2013二氧化碳排放强度(吨/平方英里/年) |
自然灾害风险
相对风险(满分10分)| 滑坡 | 平均值(6) |
| 干旱 | 低 (2) |
| 地震 | 平均值(6) |
*风险可能并不涉及整个地区,尤其是洪水或山体滑坡。
Sources: 1. Dilley, M., R.S. Chen, U. Deichmann, A.L. Lerner-Lam, M. Arnold, J. Agwe, P. Buys, O. Kjekstad, B. Lyon, and G. Yetman. 2005. Natural Disaster Hotspots: A Global Risk Analysis. Washington, D.C.: World Bank. https://doi.org/10.1596/0-8213-5930-4.
2. Center for Hazards and Risk Research - CHRR - Columbia University, Center for International Earth Science Information Network - CIESIN - Columbia University. 2005. Global Earthquake Hazard Distribution - Peak Ground Acceleration. Palisades, NY: NASA Socioeconomic Data and Applications Center (SEDAC). https://doi.org/10.7927/H4BZ63ZS.
3. Center for Hazards and Risk Research - CHRR - Columbia University, Center for International Earth Science Information Network - CIESIN - Columbia University, and Norwegian Geotechnical Institute - NGI. 2005. Global Landslide Hazard Distribution. Palisades, NY: NASA Socioeconomic Data and Applications Center (SEDAC). https://doi.org/10.7927/H4P848VZ.
4. Center for Hazards and Risk Research - CHRR - Columbia University, Center for International Earth Science Information Network - CIESIN - Columbia University, and International Research Institute for Climate and Society - IRI - Columbia University. 2005. Global Drought Hazard Frequency and Distribution. Palisades, NY: NASA Socioeconomic Data and Applications Center (SEDAC). https://doi.org/10.7927/H4VX0DFT.
最近的附近地震
幅度3.0以上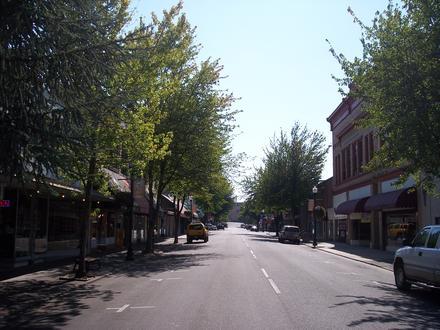
关于我们的数据
此页面上的数据是使用许多公共可用工具和资源估算的。它不提供任何保修,并且可能包含不正确的地方。使用风险自负。有关更多信息,请参见此处 。