- 世界
- »
- US
- »
- 爱达荷州
- »
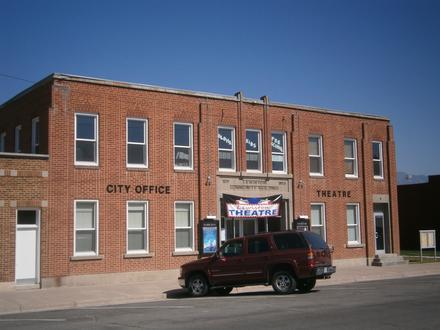
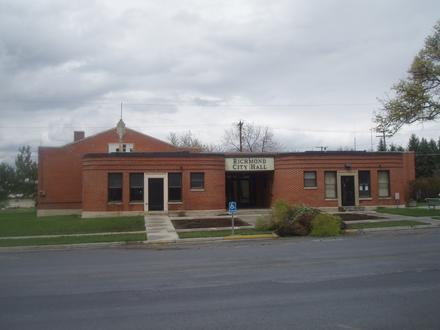
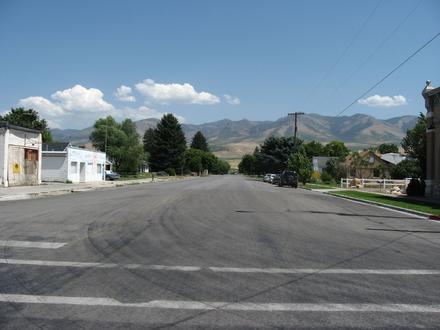
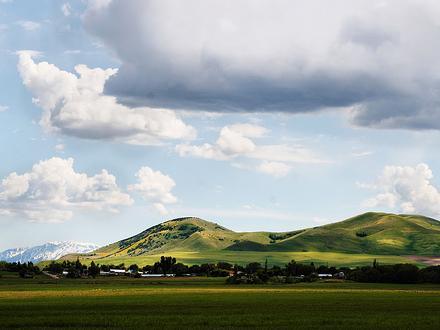
- Preston, 爱达荷州
在Preston的企业
产业领域
行业分布 工业: 13.5%
商场: 13.5%
医疗: 13.1%
国内服务: 9.7%
汽车: 9.4%
专业服务: 7.8%
金融服务: 5.1%
其他: 27.8%
| 行业说明 | 机构数 | 平均营业年龄 | Google平均评分 | 每千名居民的业务 |
|---|---|---|---|---|
| 加油站 | 14 | 33.5年 | 3.9 | 2.6 |
| 新车经销商 | 13 | 40.6年 | 4.0 | 2.4 |
| 汽车维修 | 25 | 45.4年 | 4.6 | 4.6 |
| 汽车部件 | 11 | 52年 | 4.5 | 2.0 |
| 美容院 | 7 | 28.3年 | 4.8 | 1.3 |
| 公共管理 | 22 | 55年 | 4.1 | 4.0 |
| 政府机构 | 7 | 3.3 | 1.3 | |
| 自动取款机 | 9 | 4.5 | 1.7 | |
| 贷款公司 | 15 | 39.9年 | 4.5 | 2.8 |
| 金融 - 其他 | 10 | 66.5年 | 4.3 | 1.8 |
| 银行 | 9 | 4.5 | 1.7 | |
| 杂货店和超市 | 18 | 35.5年 | 4.2 | 3.3 |
| 一般承包商 | 20 | 33年 | 4.3 | 3.7 |
| 其他建筑 | 7 | 44.9年 | 1.3 | |
| 房地产 | 25 | 39.6年 | 3.7 | 4.6 |
| 电气安装 | 7 | 28.1年 | 3.7 | 1.3 |
| 管道安装和维修 | 8 | 42.1年 | 5.0 | 1.5 |
| 其他住宿 | 8 | 40.7年 | 3.9 | 1.5 |
| 建筑材料批发 | 7 | 28.5年 | 4.7 | 1.3 |
| 拖拉机和农用设备 | 14 | 46年 | 4.0 | 2.6 |
| 机械设备批发 | 6 | 31.8年 | 3.4 | 1.1 |
| 楼宇的建筑 | 14 | 38.6年 | 4.0 | 2.6 |
| 墓地和火葬场 | 7 | 4.9 | 1.3 | |
| 健康和医疗 | 55 | 26.7年 | 4.1 | 10.1 |
| 内科医生与外科医生 | 22 | 22.6年 | 3.4 | 4.0 |
| 牙科医生 | 18 | 35.5年 | 4.8 | 3.3 |
| 脊椎治疗师 | 6 | 4.3 | 1.1 | |
| 会计 | 8 | 31.2年 | 3.8 | 1.5 |
| 律师 | 8 | 31.7年 | 4.0 | 1.5 |
| 法律和金融 | 7 | 40.8年 | 5.0 | 1.3 |
| 科学和技术服务 | 6 | 5.0 | 1.1 | |
| 教堂 | 14 | 31.6年 | 4.4 | 2.6 |
| 五金店 | 11 | 36.9年 | 4.2 | 2.0 |
| 电子产品商店 | 7 | 35.8年 | 4.9 | 1.3 |
| 苗圃和园艺用具 | 7 | 4.2 | 1.3 | |
| 购物 - 其他 | 6 | 3.9 | 1.1 |
| Preston, 爱达荷州地区 | 6.66平方英里 |
| 人口 | 5443 |
| 男性人口 | 2696 (49.5%) |
| 女性人口 | 2747 (50.5%) |
| 从1975到2015的人口变化 | +142.2% |
| 从2000到2015的人口变化 | +18% |
| 年龄中位数 | 31.5 |
| 男性平均年龄 | 30.3 |
| 女性平均年龄 | 32.7 |
| 电话区号 | 208 |
| 邻近社区 | Preston |
| 本地时间 | 星期日 00:43 |
| 时区 | 北美山区夏令时间 |
| 經度與緯度 | 42.09631° / -111.87662° |
| 邮政编码 | 83263 |
Preston, 爱达荷州 -地图
Preston, 爱达荷州人口
1975年到2015年| 数据 | 1975 | 1990 | 2000 | 2015 |
|---|---|---|---|---|
| 人口 | 2247 | 3502 | 4613 | 5443 |
| 人口密度 | 337.4 / mi² | 525.8 / mi² | 692.6 / mi² | 817.2 / mi² |
Preston从2000到2015的人口变化
从2000年到2015年增长18%| 位置 | 1975以来的变化 | 1990以来的变化 | 2000以来的变化 |
|---|---|---|---|
| Preston, 爱达荷州 | +142.2% | +55.4% | +18% |
| 爱达荷州 | +116.1% | +62.8% | +32% |
| 美国 | +46.9% | +27.2% | +13.7% |
Preston, 爱达荷州平均年龄
平均年龄:31.5年| 位置 | 年龄中位数 | 中位年龄(女) | 中位年龄(男) |
|---|---|---|---|
| Preston, 爱达荷州 | 31.5年 | 32.7年 | 30.3年 |
| 爱达荷州 | 34.9年 | 35.7年 | 34.1年 |
| 美国 | 37.4年 | 38.7年 | 36.1年 |
Preston, 爱达荷州人口树形图
年龄和性别的人口| 年龄 | 男性 | 女性 | 总 |
|---|---|---|---|
| 5岁以下 | 294 | 260 | 554 |
| 5-9 | 274 | 245 | 519 |
| 10-14 | 262 | 215 | 478 |
| 15-19 | 183 | 205 | 388 |
| 20-24 | 168 | 165 | 333 |
| 25-29 | 157 | 177 | 335 |
| 30-34 | 200 | 194 | 395 |
| 35-39 | 159 | 143 | 302 |
| 40-44 | 133 | 141 | 275 |
| 45-49 | 127 | 139 | 266 |
| 50-54 | 140 | 153 | 293 |
| 55-59 | 138 | 117 | 255 |
| 60-64 | 106 | 112 | 218 |
| 65-69 | 92 | 114 | 207 |
| 70-74 | 88 | 95 | 183 |
| 75-79 | 50 | 85 | 135 |
| 80-84 | 63 | 81 | 144 |
| 85加 | 64 | 107 | 171 |
Preston, 爱达荷州人口密度
人口密度: 817.2 / mi²| 位置 | 人口 | 面积 | 人口密度 |
|---|---|---|---|
| Preston, 爱达荷州 | 5443 | 6.66平方英里 | 817.2 / mi² |
| 爱达荷州 | 1.7 million | 83,569.2平方英里 | 20.5 / mi² |
| 美国 | 321.6 million | 3,796,761.2平方英里 | 84.7 / mi² |
Preston, 爱达荷州的历史和预计人口
从1890到2100的估计人口Sources:
1. JRC (European Commission's Joint Research Centre) work on the GHS built-up grid
2. CIESIN (Center for International Earth Science Information Network)
3. [链接] Klein Goldewijk, K., Beusen, A., Doelman, J., and Stehfest, E.: Anthropogenic land use estimates for the Holocene – HYDE 3.2, Earth Syst. Sci. Data, 9, 927–953, https://doi.org/10.5194/essd-9-927-2017, 2017.
Preston, 爱达荷州企业(按价格分布)
不贵: 48.6%
适中: 40.5%
贵: 8.1%
非常贵: 2.7%
人类发展指数(HDI)
预期寿命,教育程度和人均收入的统计综合指数。Sources: [Link] Kummu, M., Taka, M. & Guillaume, J. Gridded global datasets for Gross Domestic Product and Human Development Index over 1990–2015. Sci Data 5, 180004 (2018) doi:10.1038/sdata.2018.4
Preston, 爱达荷州二氧化碳排放
每年人均二氧化碳(CO2)排放量(吨)| 位置 | 二氧化碳排放量 | 人均二氧化碳排放量 | 二氧化碳排放强度 |
|---|---|---|---|
| Preston, 爱达荷州 | 87,115 tn | 16 tn | 13,079 tn/mi² |
| 爱达荷州 | 30,791,275 tn | 17.9 tn | 368.5 tn/mi² |
| 美国 | 5,664,619,809 tn | 17.6 tn | 1,491 tn/mi² |
Preston, 爱达荷州二氧化碳排放
| 2013年二氧化碳排放量(吨/年) | 87,115 tn |
| 2013人均二氧化碳排放量(吨/年) | 16 tn |
| 2013二氧化碳排放强度(吨/平方英里/年) |
自然灾害风险
相对风险(满分10分)| 干旱 | 高(7) |
| 地震 | 平均值(6) |
*风险可能并不涉及整个地区,尤其是洪水或山体滑坡。
Sources: 1. Dilley, M., R.S. Chen, U. Deichmann, A.L. Lerner-Lam, M. Arnold, J. Agwe, P. Buys, O. Kjekstad, B. Lyon, and G. Yetman. 2005. Natural Disaster Hotspots: A Global Risk Analysis. Washington, D.C.: World Bank. https://doi.org/10.1596/0-8213-5930-4.
2. Center for Hazards and Risk Research - CHRR - Columbia University, Center for International Earth Science Information Network - CIESIN - Columbia University. 2005. Global Earthquake Hazard Distribution - Peak Ground Acceleration. Palisades, NY: NASA Socioeconomic Data and Applications Center (SEDAC). https://doi.org/10.7927/H4BZ63ZS.
3. Center for Hazards and Risk Research - CHRR - Columbia University, Center for International Earth Science Information Network - CIESIN - Columbia University, and International Research Institute for Climate and Society - IRI - Columbia University. 2005. Global Drought Hazard Frequency and Distribution. Palisades, NY: NASA Socioeconomic Data and Applications Center (SEDAC). https://doi.org/10.7927/H4VX0DFT.
最近的附近地震
幅度3.0以上| 日期 | 时间 | 大小 | 距离 | 深度 | 位置 | 链接 |
|---|---|---|---|---|---|---|
| 2018/9/21 | 06:34 | 3.21 | 48公里 | 11,020米 | 21km NW of Montpelier, Idaho | usgs.gov |
| 2014/11/11 | 07:16 | 3.3 | 52.2公里 | 3,310米 | 17km SSE of Soda Springs, Idaho | usgs.gov |
| 2013/5/29 | 06:32 | 3.12 | 46.2公里 | 890米 | 18km NW of Garland, Utah | usgs.gov |
| 2012/7/13 | 12:53 | 3.7 | 21.9公里 | 2,500米 | Utah | usgs.gov |
| 2012/7/13 | 12:53 | 3.53 | 21.6公里 | 5,690米 | Utah | usgs.gov |
| 2011/7/25 | 20:38 | 3.65 | 26.7公里 | 70米 | southern Idaho | usgs.gov |
| 2011/7/25 | 20:38 | 3.5 | 26.7公里 | 1,100米 | southern Idaho | usgs.gov |
| 2011/1/25 | 21:10 | 3.7 | 47.9公里 | 5,800米 | southern Idaho | usgs.gov |
| 2011/1/25 | 21:10 | 3.73 | 48.6公里 | 440米 | southern Idaho | usgs.gov |
| 2011/1/12 | 14:04 | 3.1 | 27.8公里 | 3,200米 | southern Idaho | usgs.gov |
查找Preston, 爱达荷州附近的历史地震事件
最早日期 最新日期
幅度3.0以上 幅度4.0及更高 震级5.0以上
关于我们的数据
此页面上的数据是使用许多公共可用工具和资源估算的。它不提供任何保修,并且可能包含不正确的地方。使用风险自负。有关更多信息,请参见此处 。