- 世界
- »
- US
- »
- 俄勒冈州
- »
- North Bend, 俄勒冈州
在North Bend的企业
产业领域
行业分布 商场: 20%
医疗: 10.3%
专业服务: 8.9%
工业: 8.8%
餐馆: 8.1%
国内服务: 6.3%
汽车: 5%
其他: 32.6%
| 行业说明 | 机构数 | 平均营业年龄 | Google平均评分 | 每千名居民的业务 |
|---|---|---|---|---|
| 加油站 | 14 | 41.1年 | 3.9 | 1.5 |
| 汽车维修 | 29 | 35.8年 | 4.4 | 3.1 |
| 理发师 | 15 | 25.2年 | 3.4 | 1.6 |
| 美容院 | 20 | 24.1年 | 4.5 | 2.2 |
| 公共管理 | 30 | 29.8年 | 3.3 | 3.2 |
| 政府机构 | 21 | 26.5年 | 3.3 | 2.3 |
| 社会工作 | 31 | 27年 | 3.7 | 3.3 |
| 自动取款机 | 19 | 54.9年 | 3.7 | 2.0 |
| 贷款公司 | 19 | 51.2年 | 3.7 | 2.0 |
| 金融 - 其他 | 16 | 36.7年 | 3.3 | 1.7 |
| 银行 | 20 | 36.9年 | 3.3 | 2.2 |
| 便利店 | 11 | 54.3年 | 4.0 | 1.2 |
| 杂货店和超市 | 21 | 30.8年 | 3.6 | 2.3 |
| 一般承包商 | 50 | 27.8年 | 4.3 | 5.4 |
| 其他建筑 | 21 | 28.1年 | 4.6 | 2.3 |
| 房地产 | 20 | 26.8年 | 3.9 | 2.2 |
| 电气安装 | 11 | 42.8年 | 4.0 | 1.2 |
| 其他住宿 | 13 | 36.9年 | 4.0 | 1.4 |
| 其他会员组织 | 19 | 25.4年 | 4.3 | 2.0 |
| 建筑材料批发 | 16 | 52.4年 | 4.1 | 1.7 |
| 拖拉机和农用设备 | 11 | 36.5年 | 4.4 | 1.2 |
| 机械设备批发 | 20 | 36.2年 | 4.3 | 2.2 |
| 楼宇的建筑 | 29 | 29.6年 | 3.4 | 3.1 |
| 健康和医疗 | 119 | 27年 | 4.5 | 12.8 |
| 内科医生与外科医生 | 45 | 23.3年 | 3.2 | 4.8 |
| 牙科医生 | 17 | 47.8年 | 4.9 | 1.8 |
| 退休之家 | 11 | 30.1年 | 4.2 | 1.2 |
| 会计 | 14 | 36.7年 | 3.3 | 1.5 |
| 律师 | 15 | 38.6年 | 4.6 | 1.6 |
| 教堂 | 25 | 63.7年 | 4.6 | 2.7 |
| 咖啡 | 19 | 20.1年 | 4.5 | 2.0 |
| 美国餐馆 | 15 | 35年 | 4.2 | 1.6 |
| 五金店 | 14 | 37.5年 | 3.4 | 1.5 |
| 家用电器和物品 | 11 | 28.2年 | 3.4 | 1.2 |
| 服装店 | 16 | 46.7年 | 3.5 | 1.7 |
| 电子产品商店 | 19 | 24.9年 | 3.5 | 2.0 |
| 药房和药店 | 19 | 44年 | 3.6 | 2.0 |
| 购物 - 其他 | 20 | 37.5年 | 3.6 | 2.2 |
| 公园 | 17 | 30.7年 | 4.4 | 1.8 |
| North Bend, 俄勒冈州地区 | 5.09平方英里 |
| 人口 | 9283 |
| 男性人口 | 4436 (47.8%) |
| 女性人口 | 4847 (52.2%) |
| 从1975到2015的人口变化 | +108.3% |
| 从2000到2015的人口变化 | -1% |
| 年龄中位数 | 42 |
| 男性平均年龄 | 39.4 |
| 女性平均年龄 | 44.3 |
| 电话区号 | 541 |
| 邻近社区 | North Bend |
| 本地时间 | 星期六 23:00 |
| 时区 | 北美太平洋夏令时间 |
| 經度與緯度 | 43.4065° / -124.22428° |
| 邮政编码 | 97459 |
North Bend, 俄勒冈州 -地图
North Bend, 俄勒冈州人口
1975年到2015年| 数据 | 1975 | 1990 | 2000 | 2015 |
|---|---|---|---|---|
| 人口 | 4457 | 6989 | 9379 | 9283 |
| 人口密度 | 875.8 / mi² | 1373 / mi² | 1843 / mi² | 1824 / mi² |
North Bend从2000到2015的人口变化
从2000年到2015年下降1%| 位置 | 1975以来的变化 | 1990以来的变化 | 2000以来的变化 |
|---|---|---|---|
| North Bend, 俄勒冈州 | +108.3% | +32.8% | -1% |
| 俄勒冈州 | +65% | +34.6% | +16.8% |
| 美国 | +46.9% | +27.2% | +13.7% |
North Bend, 俄勒冈州平均年龄
平均年龄:42年| 位置 | 年龄中位数 | 中位年龄(女) | 中位年龄(男) |
|---|---|---|---|
| North Bend, 俄勒冈州 | 42年 | 44.3年 | 39.4年 |
| 俄勒冈州 | 38.5年 | 39.6年 | 37.3年 |
| 美国 | 37.4年 | 38.7年 | 36.1年 |
North Bend, 俄勒冈州人口树形图
年龄和性别的人口| 年龄 | 男性 | 女性 | 总 |
|---|---|---|---|
| 5岁以下 | 297 | 277 | 574 |
| 5-9 | 282 | 252 | 534 |
| 10-14 | 273 | 279 | 552 |
| 15-19 | 287 | 283 | 570 |
| 20-24 | 309 | 294 | 604 |
| 25-29 | 288 | 305 | 593 |
| 30-34 | 279 | 258 | 537 |
| 35-39 | 232 | 255 | 488 |
| 40-44 | 238 | 259 | 497 |
| 45-49 | 312 | 361 | 673 |
| 50-54 | 316 | 344 | 661 |
| 55-59 | 332 | 350 | 683 |
| 60-64 | 300 | 318 | 619 |
| 65-69 | 204 | 291 | 495 |
| 70-74 | 157 | 201 | 359 |
| 75-79 | 113 | 170 | 284 |
| 80-84 | 90 | 151 | 242 |
| 85加 | 125 | 200 | 326 |
North Bend, 俄勒冈州人口密度
人口密度: 1824 / mi²| 位置 | 人口 | 面积 | 人口密度 |
|---|---|---|---|
| North Bend, 俄勒冈州 | 9283 | 5.09平方英里 | 1824 / mi² |
| 俄勒冈州 | 4.0 million | 98,379.3平方英里 | 40.8 / mi² |
| 美国 | 321.6 million | 3,796,761.2平方英里 | 84.7 / mi² |
North Bend, 俄勒冈州历史人口
从1880到2015的估计人口Sources:
1. JRC (European Commission's Joint Research Centre) work on the GHS built-up grid
2. CIESIN (Center for International Earth Science Information Network)
3. [链接] Klein Goldewijk, K., Beusen, A., Doelman, J., and Stehfest, E.: Anthropogenic land use estimates for the Holocene – HYDE 3.2, Earth Syst. Sci. Data, 9, 927–953, https://doi.org/10.5194/essd-9-927-2017, 2017.
North Bend, 俄勒冈州企业(按价格分布)
适中: 55.9%
不贵: 34.2%
贵: 5.9%
非常贵: 3.9%
人类发展指数(HDI)
预期寿命,教育程度和人均收入的统计综合指数。Sources: [Link] Kummu, M., Taka, M. & Guillaume, J. Gridded global datasets for Gross Domestic Product and Human Development Index over 1990–2015. Sci Data 5, 180004 (2018) doi:10.1038/sdata.2018.4
North Bend, 俄勒冈州二氧化碳排放
每年人均二氧化碳(CO2)排放量(吨)| 位置 | 二氧化碳排放量 | 人均二氧化碳排放量 | 二氧化碳排放强度 |
|---|---|---|---|
| North Bend, 俄勒冈州 | 146,158 tn | 15.7 tn | 28,721 tn/mi² |
| 俄勒冈州 | 70,678,562 tn | 17.6 tn | 718.4 tn/mi² |
| 美国 | 5,664,619,809 tn | 17.6 tn | 1,491 tn/mi² |
North Bend, 俄勒冈州二氧化碳排放
| 2013年二氧化碳排放量(吨/年) | 146,158 tn |
| 2013人均二氧化碳排放量(吨/年) | 15.7 tn |
| 2013二氧化碳排放强度(吨/平方英里/年) |
自然灾害风险
相对风险(满分10分)| 干旱 | 低 (2) |
| 地震 | 高(8) |
*风险可能并不涉及整个地区,尤其是洪水或山体滑坡。
Sources: 1. Dilley, M., R.S. Chen, U. Deichmann, A.L. Lerner-Lam, M. Arnold, J. Agwe, P. Buys, O. Kjekstad, B. Lyon, and G. Yetman. 2005. Natural Disaster Hotspots: A Global Risk Analysis. Washington, D.C.: World Bank. https://doi.org/10.1596/0-8213-5930-4.
2. Center for Hazards and Risk Research - CHRR - Columbia University, Center for International Earth Science Information Network - CIESIN - Columbia University. 2005. Global Earthquake Hazard Distribution - Peak Ground Acceleration. Palisades, NY: NASA Socioeconomic Data and Applications Center (SEDAC). https://doi.org/10.7927/H4BZ63ZS.
3. Center for Hazards and Risk Research - CHRR - Columbia University, Center for International Earth Science Information Network - CIESIN - Columbia University, and International Research Institute for Climate and Society - IRI - Columbia University. 2005. Global Drought Hazard Frequency and Distribution. Palisades, NY: NASA Socioeconomic Data and Applications Center (SEDAC). https://doi.org/10.7927/H4VX0DFT.
最近的附近地震
幅度3.0以上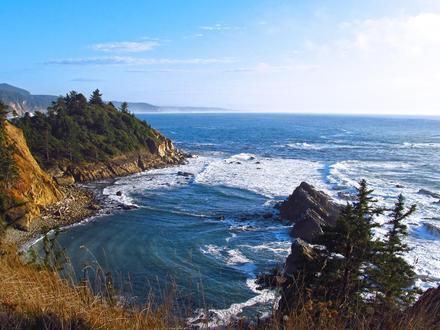
关于我们的数据
此页面上的数据是使用许多公共可用工具和资源估算的。它不提供任何保修,并且可能包含不正确的地方。使用风险自负。有关更多信息,请参见此处 。