- 世界
- »
- US
- »
- 俄勒冈州
- »
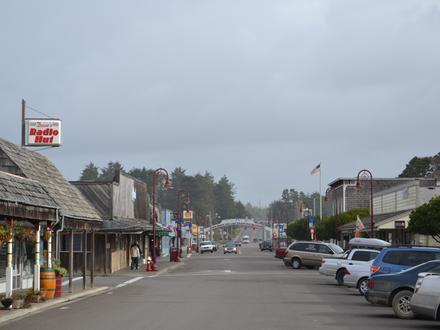
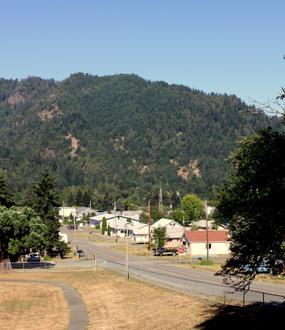
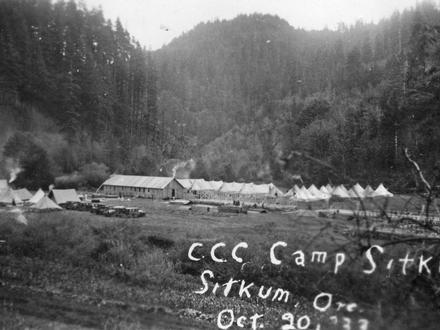
- Myrtle Point, 俄勒冈州
在Myrtle Point的企业
产业领域
行业分布 商场: 16.4%
工业: 15.3%
专业服务: 10.3%
国内服务: 9.8%
餐馆: 5.3%
汽车: 5%
其他: 37.8%
| 行业说明 | 机构数 | 平均营业年龄 | Google平均评分 | 每千名居民的业务 |
|---|---|---|---|---|
| 汽车维修 | 8 | 39.8年 | 4.7 | 3.3 |
| 公共管理 | 10 | 31.4年 | 4.3 | 4.1 |
| 中小学 | 6 | 52.2年 | 3.2 | 2.5 |
| 杂货店和超市 | 12 | 36年 | 4.3 | 4.9 |
| 一般承包商 | 13 | 33.1年 | 4.2 | 5.3 |
| 房地产 | 6 | 28.9年 | 4.2 | 2.5 |
| 建筑材料批发 | 6 | 31.3年 | 5.0 | 2.5 |
| 拖拉机和农用设备 | 6 | 16.9年 | 4.4 | 2.5 |
| 楼宇的建筑 | 7 | 26.8年 | 2.9 | |
| 墓地和火葬场 | 8 | 39.9年 | 5.0 | 3.3 |
| 退休之家 | 6 | 37.3年 | 4.2 | 2.5 |
| 企业管理 | 6 | 37.3年 | 2.5 | |
| 会计 | 6 | 43.3年 | 5.0 | 2.5 |
| 科学和技术服务 | 9 | 31.3年 | 4.4 | 3.7 |
| 教堂 | 10 | 63.8年 | 4.8 | 4.1 |
| 五金店 | 5 | 35.9年 | 4.8 | 2.1 |
| 购物 - 其他 | 6 | 2.5 | ||
| 公园 | 13 | 3.7 | 5.3 |
| Myrtle Point, 俄勒冈州地区 | 1.622平方英里 |
| 人口 | 2434 |
| 男性人口 | 1174 (48.2%) |
| 女性人口 | 1260 (51.8%) |
| 从1975到2015的人口变化 | +108.9% |
| 从2000到2015的人口变化 | -1.1% |
| 年龄中位数 | 44.9 |
| 男性平均年龄 | 44 |
| 女性平均年龄 | 45.7 |
| 电话区号 | 541 |
| 本地时间 | 星期六 22:59 |
| 时区 | 北美太平洋夏令时间 |
| 經度與緯度 | 43.06483° / -124.13899° |
| 邮政编码 | 97458 |
Myrtle Point, 俄勒冈州 -地图
Myrtle Point, 俄勒冈州人口
1975年到2015年| 数据 | 1975 | 1990 | 2000 | 2015 |
|---|---|---|---|---|
| 人口 | 1165 | 1829 | 2460 | 2434 |
| 人口密度 | 718.4 / mi² | 1127 / mi² | 1516 / mi² | 1500 / mi² |
Myrtle Point从2000到2015的人口变化
从2000年到2015年下降1.1%| 位置 | 1975以来的变化 | 1990以来的变化 | 2000以来的变化 |
|---|---|---|---|
| Myrtle Point, 俄勒冈州 | +108.9% | +33.1% | -1.1% |
| 俄勒冈州 | +65% | +34.6% | +16.8% |
| 美国 | +46.9% | +27.2% | +13.7% |
Myrtle Point, 俄勒冈州平均年龄
平均年龄:44.9年| 位置 | 年龄中位数 | 中位年龄(女) | 中位年龄(男) |
|---|---|---|---|
| Myrtle Point, 俄勒冈州 | 44.9年 | 45.7年 | 44年 |
| 俄勒冈州 | 38.5年 | 39.6年 | 37.3年 |
| 美国 | 37.4年 | 38.7年 | 36.1年 |
Myrtle Point, 俄勒冈州人口树形图
年龄和性别的人口| 年龄 | 男性 | 女性 | 总 |
|---|---|---|---|
| 5岁以下 | 71 | 81 | 152 |
| 5-9 | 74 | 64 | 139 |
| 10-14 | 71 | 74 | 145 |
| 15-19 | 89 | 85 | 174 |
| 20-24 | 48 | 63 | 112 |
| 25-29 | 51 | 55 | 106 |
| 30-34 | 56 | 67 | 123 |
| 35-39 | 70 | 69 | 139 |
| 40-44 | 73 | 59 | 133 |
| 45-49 | 81 | 89 | 171 |
| 50-54 | 89 | 88 | 177 |
| 55-59 | 71 | 98 | 170 |
| 60-64 | 79 | 80 | 160 |
| 65-69 | 64 | 92 | 156 |
| 70-74 | 76 | 71 | 147 |
| 75-79 | 51 | 51 | 103 |
| 80-84 | 38 | 39 | 77 |
| 85加 | 25 | 34 | 59 |
Myrtle Point, 俄勒冈州人口密度
人口密度: 1500 / mi²| 位置 | 人口 | 面积 | 人口密度 |
|---|---|---|---|
| Myrtle Point, 俄勒冈州 | 2434 | 1.622平方英里 | 1500 / mi² |
| 俄勒冈州 | 4.0 million | 98,379.3平方英里 | 40.8 / mi² |
| 美国 | 321.6 million | 3,796,761.2平方英里 | 84.7 / mi² |
Myrtle Point, 俄勒冈州历史人口
从1870到2015的估计人口Sources:
1. JRC (European Commission's Joint Research Centre) work on the GHS built-up grid
2. CIESIN (Center for International Earth Science Information Network)
3. [链接] Klein Goldewijk, K., Beusen, A., Doelman, J., and Stehfest, E.: Anthropogenic land use estimates for the Holocene – HYDE 3.2, Earth Syst. Sci. Data, 9, 927–953, https://doi.org/10.5194/essd-9-927-2017, 2017.
Myrtle Point, 俄勒冈州企业(按价格分布)
适中: 57.9%
不贵: 26.3%
贵: 15.8%
人类发展指数(HDI)
预期寿命,教育程度和人均收入的统计综合指数。Sources: [Link] Kummu, M., Taka, M. & Guillaume, J. Gridded global datasets for Gross Domestic Product and Human Development Index over 1990–2015. Sci Data 5, 180004 (2018) doi:10.1038/sdata.2018.4
Myrtle Point, 俄勒冈州二氧化碳排放
每年人均二氧化碳(CO2)排放量(吨)| 位置 | 二氧化碳排放量 | 人均二氧化碳排放量 | 二氧化碳排放强度 |
|---|---|---|---|
| Myrtle Point, 俄勒冈州 | 40,369 tn | 16.6 tn | 24,893 tn/mi² |
| 俄勒冈州 | 70,678,562 tn | 17.6 tn | 718.4 tn/mi² |
| 美国 | 5,664,619,809 tn | 17.6 tn | 1,491 tn/mi² |
Myrtle Point, 俄勒冈州二氧化碳排放
| 2013年二氧化碳排放量(吨/年) | 40,369 tn |
| 2013人均二氧化碳排放量(吨/年) | 16.6 tn |
| 2013二氧化碳排放强度(吨/平方英里/年) |
自然灾害风险
相对风险(满分10分)| 地震 | 高(7) |
*风险可能并不涉及整个地区,尤其是洪水或山体滑坡。
Sources: 1. Dilley, M., R.S. Chen, U. Deichmann, A.L. Lerner-Lam, M. Arnold, J. Agwe, P. Buys, O. Kjekstad, B. Lyon, and G. Yetman. 2005. Natural Disaster Hotspots: A Global Risk Analysis. Washington, D.C.: World Bank. https://doi.org/10.1596/0-8213-5930-4.
2. Center for Hazards and Risk Research - CHRR - Columbia University, Center for International Earth Science Information Network - CIESIN - Columbia University. 2005. Global Earthquake Hazard Distribution - Peak Ground Acceleration. Palisades, NY: NASA Socioeconomic Data and Applications Center (SEDAC). https://doi.org/10.7927/H4BZ63ZS.
最近的附近地震
幅度3.0以上| 日期 | 时间 | 大小 | 距离 | 深度 | 位置 | 链接 |
|---|---|---|---|---|---|---|
| 2016/12/4 | 22:42 | 3.3 | 33.5公里 | 15,790米 | 14km SW of Barview, Oregon | usgs.gov |
| 2014/5/5 | 21:07 | 3.19 | 96.5公里 | 23,937米 | 24km WSW of Gold Beach, Oregon | usgs.gov |
| 2014/1/24 | 05:53 | 3.83 | 52.5公里 | 4,300米 | 44km ENE of Gold Beach, Oregon | usgs.gov |
| 2012/2/26 | 02:15 | 3.12 | 57.9公里 | 21,643米 | offshore Oregon | usgs.gov |
| 2010/7/3 | 15:25 | 3.45 | 65.7公里 | 34,306米 | Oregon | usgs.gov |
| 2009/2/26 | 01:52 | 4.24 | 61.5公里 | 36,796米 | Oregon | usgs.gov |
| 2005/9/14 | 08:46 | 3.13 | 73.2公里 | 9,954米 | offshore Oregon | usgs.gov |
| 1980/8/3 | 07:43 | 4.5 | 71.8公里 | 15,000米 | offshore Oregon | usgs.gov |

关于我们的数据
此页面上的数据是使用许多公共可用工具和资源估算的。它不提供任何保修,并且可能包含不正确的地方。使用风险自负。有关更多信息,请参见此处 。