- 世界
- »
- US
- »
- 俄勒冈州
- »
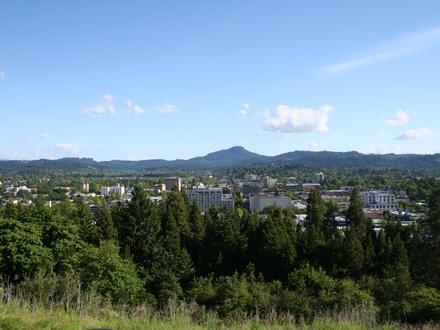
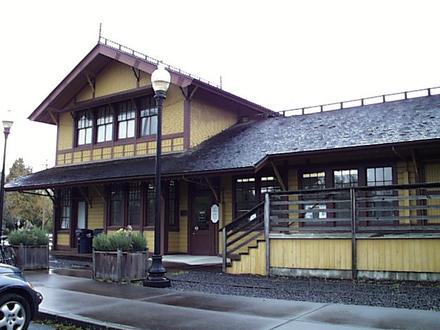
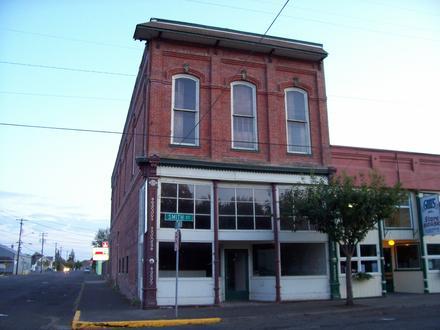
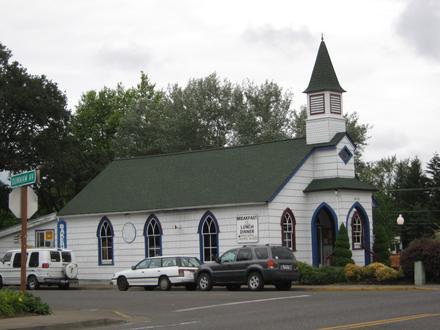
- Junction City, 俄勒冈州
在Junction City的企业
产业领域
行业分布 商场: 15.3%
工业: 14.8%
国内服务: 11.5%
专业服务: 9.6%
汽车: 8.6%
食品: 5.9%
医疗: 5.3%
餐馆: 5.2%
其他: 23.8%
| 行业说明 | 机构数 | 平均营业年龄 | Google平均评分 | 每千名居民的业务 |
|---|---|---|---|---|
| 大篷车、休闲车和旅游汽车 | 10 | 41年 | 4.3 | 2.0 |
| 新车经销商 | 12 | 39.5年 | 4.3 | 2.4 |
| 汽车维修 | 38 | 37.4年 | 4.3 | 7.8 |
| 汽车部件 | 15 | 47.3年 | 4.3 | 3.1 |
| 煞车、消音器和变速器 | 8 | 44.3年 | 4.1 | 1.6 |
| 美容院 | 9 | 26.1年 | 4.3 | 1.8 |
| 学前班和幼儿园 | 10 | 25.1年 | 3.6 | 2.0 |
| 贷款公司 | 11 | 43.9年 | 3.9 | 2.2 |
| 金融 - 其他 | 9 | 71.7年 | 4.3 | 1.8 |
| 银行 | 8 | 73.9年 | 3.0 | 1.6 |
| 杂货店和超市 | 39 | 40.3年 | 4.2 | 8.0 |
| 水果和蔬菜 | 12 | 39.2年 | 4.5 | 2.4 |
| 一般承包商 | 40 | 32.6年 | 4.1 | 8.2 |
| 公寓 | 9 | 36年 | 3.9 | 1.8 |
| 其他建筑 | 28 | 32.9年 | 4.1 | 5.7 |
| 园林绿化 | 13 | 29.2年 | 4.8 | 2.7 |
| 常规清洗服务 | 9 | 25.9年 | 3.8 | 1.8 |
| 建筑物的拆除和场地的准备 | 8 | 29.1年 | 1.6 | |
| 房地产 | 26 | 29.7年 | 4.2 | 5.3 |
| 搬家公司 | 12 | 42.6年 | 4.1 | 2.4 |
| 管道安装和维修 | 8 | 41.3年 | 3.8 | 1.6 |
| 其他住宿 | 11 | 25.8年 | 3.9 | 2.2 |
| 储存和入库 | 11 | 29.3年 | 4.3 | 2.2 |
| 其他会员组织 | 13 | 51.9年 | 4.4 | 2.7 |
| 建筑材料批发 | 16 | 33.6年 | 4.2 | 3.3 |
| 拖拉机和农用设备 | 20 | 34.6年 | 4.5 | 4.1 |
| 楼宇的建筑 | 22 | 33.9年 | 3.9 | 4.5 |
| 货运/商业运输 | 18 | 41年 | 4.1 | 3.7 |
| 儿童保育和日托 | 9 | 21.8年 | 5.0 | 1.8 |
| 健康和医疗 | 18 | 35.7年 | 3.4 | 3.7 |
| 退休之家 | 9 | 30.7年 | 4.3 | 1.8 |
| 企业管理 | 12 | 32.4年 | 5.0 | 2.4 |
| 会计 | 11 | 36年 | 5.0 | 2.2 |
| 科学和技术服务 | 23 | 22.5年 | 4.7 | 4.7 |
| 教堂 | 18 | 55年 | 4.3 | 3.7 |
| 五金店 | 13 | 32.4年 | 4.5 | 2.7 |
| 家用电器和物品 | 10 | 28.9年 | 4.0 | 2.0 |
| 苗圃和园艺用具 | 12 | 35.7年 | 4.3 | 2.4 |
| 药房和药店 | 8 | 3.9 | 1.6 | |
| 购物 - 其他 | 16 | 42.4年 | 4.6 | 3.3 |
| 公园 | 16 | 28.8年 | 4.2 | 3.3 |
| Junction City, 俄勒冈州地区 | 2.359平方英里 |
| 人口 | 4898 |
| 男性人口 | 2363 (48.2%) |
| 女性人口 | 2535 (51.8%) |
| 从1975到2015的人口变化 | +87.4% |
| 从2000到2015的人口变化 | +13.8% |
| 年龄中位数 | 37.1 |
| 男性平均年龄 | 34.8 |
| 女性平均年龄 | 39.2 |
| 电话区号 | 541 |
| 邻近社区 | Junction City, West Eugene, Western |
| 本地时间 | 星期六 23:00 |
| 时区 | 北美太平洋夏令时间 |
| 經度與緯度 | 44.21929° / -123.20565° |
| 邮政编码 | 97448 |
Junction City, 俄勒冈州 -地图
Junction City, 俄勒冈州人口
1975年到2015年| 数据 | 1975 | 1990 | 2000 | 2015 |
|---|---|---|---|---|
| 人口 | 2613 | 3492 | 4303 | 4898 |
| 人口密度 | 1107 / mi² | 1480 / mi² | 1824 / mi² | 2076 / mi² |
Junction City从2000到2015的人口变化
从2000年到2015年增长13.8%| 位置 | 1975以来的变化 | 1990以来的变化 | 2000以来的变化 |
|---|---|---|---|
| Junction City, 俄勒冈州 | +87.4% | +40.3% | +13.8% |
| 俄勒冈州 | +65% | +34.6% | +16.8% |
| 美国 | +46.9% | +27.2% | +13.7% |
Junction City, 俄勒冈州平均年龄
平均年龄:37.1年| 位置 | 年龄中位数 | 中位年龄(女) | 中位年龄(男) |
|---|---|---|---|
| Junction City, 俄勒冈州 | 37.1年 | 39.2年 | 34.8年 |
| 俄勒冈州 | 38.5年 | 39.6年 | 37.3年 |
| 美国 | 37.4年 | 38.7年 | 36.1年 |
Junction City, 俄勒冈州人口树形图
年龄和性别的人口| 年龄 | 男性 | 女性 | 总 |
|---|---|---|---|
| 5岁以下 | 184 | 145 | 330 |
| 5-9 | 169 | 181 | 351 |
| 10-14 | 193 | 166 | 360 |
| 15-19 | 173 | 147 | 320 |
| 20-24 | 155 | 152 | 308 |
| 25-29 | 156 | 173 | 330 |
| 30-34 | 155 | 167 | 322 |
| 35-39 | 163 | 165 | 328 |
| 40-44 | 145 | 146 | 292 |
| 45-49 | 147 | 181 | 329 |
| 50-54 | 174 | 174 | 348 |
| 55-59 | 153 | 195 | 349 |
| 60-64 | 116 | 132 | 248 |
| 65-69 | 96 | 122 | 218 |
| 70-74 | 76 | 96 | 172 |
| 75-79 | 53 | 79 | 132 |
| 80-84 | 26 | 53 | 79 |
| 85加 | 29 | 63 | 92 |
Junction City, 俄勒冈州人口密度
人口密度: 2076 / mi²| 位置 | 人口 | 面积 | 人口密度 |
|---|---|---|---|
| Junction City, 俄勒冈州 | 4898 | 2.359平方英里 | 2076 / mi² |
| 俄勒冈州 | 4.0 million | 98,379.3平方英里 | 40.8 / mi² |
| 美国 | 321.6 million | 3,796,761.2平方英里 | 84.7 / mi² |
Junction City, 俄勒冈州的历史和预计人口
从1870到2100的估计人口Sources:
1. JRC (European Commission's Joint Research Centre) work on the GHS built-up grid
2. CIESIN (Center for International Earth Science Information Network)
3. [链接] Klein Goldewijk, K., Beusen, A., Doelman, J., and Stehfest, E.: Anthropogenic land use estimates for the Holocene – HYDE 3.2, Earth Syst. Sci. Data, 9, 927–953, https://doi.org/10.5194/essd-9-927-2017, 2017.
邻近社区
Junction City企业(按街区分布) Junction City: 40.5%
Western: 8.1%
West Eugene: 8.1%
Bethel-Danebo: 5.4%
Industrial Corridor: 5.4%
Harlow: 2.7%
Downtown: 2.7%
Cal Young: 2.7%
Fox Hollow: 2.7%
River Road: 2.7%
Willakenzie: 2.7%
Awbrey Butte: 2.7%
North Portland: 2.7%
Downtown Eugene: 2.7%
Southeast Salem: 2.7%
Northeast Hillsboro: 2.7%
West Eugene Community: 2.7%
Junction City, 俄勒冈州企业(按价格分布)
不贵: 47.4%
适中: 43.6%
贵: 6.4%
非常贵: 2.6%
人类发展指数(HDI)
预期寿命,教育程度和人均收入的统计综合指数。Sources: [Link] Kummu, M., Taka, M. & Guillaume, J. Gridded global datasets for Gross Domestic Product and Human Development Index over 1990–2015. Sci Data 5, 180004 (2018) doi:10.1038/sdata.2018.4
Junction City, 俄勒冈州二氧化碳排放
每年人均二氧化碳(CO2)排放量(吨)| 位置 | 二氧化碳排放量 | 人均二氧化碳排放量 | 二氧化碳排放强度 |
|---|---|---|---|
| Junction City, 俄勒冈州 | 79,611 tn | 16.3 tn | 33,746 tn/mi² |
| 俄勒冈州 | 70,678,562 tn | 17.6 tn | 718.4 tn/mi² |
| 美国 | 5,664,619,809 tn | 17.6 tn | 1,491 tn/mi² |
Junction City, 俄勒冈州二氧化碳排放
| 2013年二氧化碳排放量(吨/年) | 79,611 tn |
| 2013人均二氧化碳排放量(吨/年) | 16.3 tn |
| 2013二氧化碳排放强度(吨/平方英里/年) |
自然灾害风险
相对风险(满分10分)| 干旱 | 低 (2) |
| 洪水 | 平均值(4) |
| 地震 | 平均值(4) |
*风险可能并不涉及整个地区,尤其是洪水或山体滑坡。
Sources: 1. Dilley, M., R.S. Chen, U. Deichmann, A.L. Lerner-Lam, M. Arnold, J. Agwe, P. Buys, O. Kjekstad, B. Lyon, and G. Yetman. 2005. Natural Disaster Hotspots: A Global Risk Analysis. Washington, D.C.: World Bank. https://doi.org/10.1596/0-8213-5930-4.
2. Center for Hazards and Risk Research - CHRR - Columbia University, Center for International Earth Science Information Network - CIESIN - Columbia University. 2005. Global Earthquake Hazard Distribution - Peak Ground Acceleration. Palisades, NY: NASA Socioeconomic Data and Applications Center (SEDAC). https://doi.org/10.7927/H4BZ63ZS.
3. Center for Hazards and Risk Research - CHRR - Columbia University, Center for International Earth Science Information Network - CIESIN - Columbia University, and International Research Institute for Climate and Society - IRI - Columbia University. 2005. Global Drought Hazard Frequency and Distribution. Palisades, NY: NASA Socioeconomic Data and Applications Center (SEDAC). https://doi.org/10.7927/H4VX0DFT.
4. Center for Hazards and Risk Research - CHRR - Columbia University, Center for International Earth Science Information Network - CIESIN - Columbia University. 2005. Global Flood Hazard Frequency and Distribution. Palisades, NY: NASA Socioeconomic Data and Applications Center (SEDAC). https://doi.org/10.7927/H4668B3D.
最近的附近地震
幅度3.0以上| 日期 | 时间 | 大小 | 距离 | 深度 | 位置 | 链接 |
|---|---|---|---|---|---|---|
| 2018/4/14 | 20:45 | 3.08 | 88.3公里 | 18,380米 | 6km SSE of Silverton, Oregon | usgs.gov |
| 2015/7/4 | 08:42 | 4.14 | 33.3公里 | 7,950米 | 15km ENE of Springfield, Oregon | usgs.gov |
| 2014/12/19 | 06:01 | 3.08 | 86.4公里 | 24,379米 | 12km SSE of Grand Ronde, Oregon | usgs.gov |
| 2012/3/20 | 01:43 | 3.17 | 99.7公里 | 29,190米 | offshore Oregon | usgs.gov |
| 2007/9/23 | 23:20 | 3.6 | 99.2公里 | 23,430米 | Oregon | usgs.gov |
| 2006/3/4 | 09:38 | 3.3 | 71.8公里 | 42,775米 | Oregon | usgs.gov |
| 2000/12/29 | 17:52 | 3.1 | 57.7公里 | 61,944米 | Oregon | usgs.gov |
| 1996/8/2 | 04:46 | 3.53 | 96.6公里 | 28,715米 | Oregon | usgs.gov |
| 1995/3/12 | 20:51 | 3.02 | 54.4公里 | 23,505米 | Oregon | usgs.gov |
| 1963/3/7 | 15:53 | 4.6 | 82公里 | None | Oregon | usgs.gov |
查找Junction City, 俄勒冈州附近的历史地震事件
最早日期 最新日期
幅度3.0以上 幅度4.0及更高 震级5.0以上
关于我们的数据
此页面上的数据是使用许多公共可用工具和资源估算的。它不提供任何保修,并且可能包含不正确的地方。使用风险自负。有关更多信息,请参见此处 。