- 世界
- »
- US
- »
- 内华达州
- »
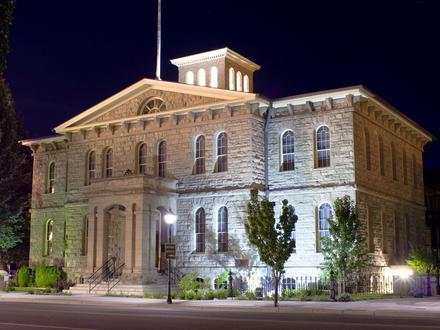
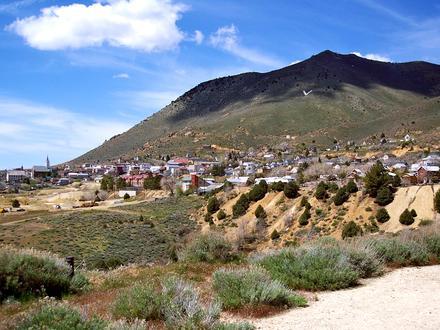
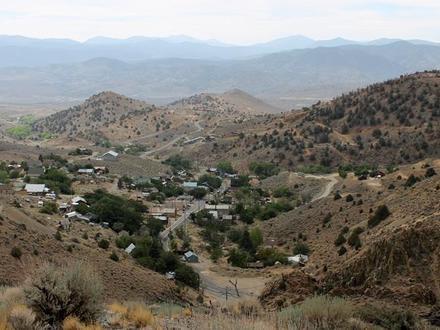
- Dayton, 内华达州
在Dayton的企业
产业领域
行业分布 商场: 12.2%
国内服务: 12.1%
工业: 11.3%
专业服务: 9.1%
本地服务: 7.8%
餐馆: 7.7%
医疗: 5.8%
金融服务: 4.9%
其他: 29.1%
| 行业说明 | 机构数 | 平均营业年龄 | Google平均评分 | 每千名居民的业务 |
|---|---|---|---|---|
| 加油站 | 9 | 31.2年 | 4.0 | 0.8 |
| 汽车维修 | 5 | 4.1 | 0.5 | |
| 理发师 | 6 | 26.3年 | 4.3 | 0.6 |
| 美容院 | 8 | 23.1年 | 4.3 | 0.7 |
| 公共管理 | 5 | 2.0 | 0.5 | |
| 社会工作 | 5 | 0.5 | ||
| 中小学 | 6 | 3.4 | 0.6 | |
| 创意艺术 | 5 | 23.1年 | 4.1 | 0.5 |
| 自动取款机 | 12 | 125.5年 | 3.7 | 1.1 |
| 贷款公司 | 9 | 2.6 | 0.8 | |
| 金融 - 其他 | 7 | 3.4 | 0.7 | |
| 银行 | 12 | 101.1年 | 3.7 | 1.1 |
| 杂货店和超市 | 10 | 27.2年 | 4.3 | 0.9 |
| 一般承包商 | 22 | 28.4年 | 3.1 | 2.0 |
| 其他建筑 | 10 | 33.9年 | 5.0 | 0.9 |
| 园林绿化 | 8 | 24.8年 | 4.5 | 0.7 |
| 常规清洗服务 | 6 | 5.0 | 0.6 | |
| 房地产 | 14 | 20.5年 | 3.2 | 1.3 |
| 房屋建设 | 6 | 4.0 | 0.6 | |
| 储存和入库 | 10 | 31年 | 4.4 | 0.9 |
| 其他会员组织 | 8 | 18年 | 4.2 | 0.7 |
| 建 筑 业 | 5 | 42.5年 | 0.5 | |
| 建筑材料批发 | 6 | 41.5年 | 0.6 | |
| 机械设备批发 | 9 | 48.7年 | 3.3 | 0.8 |
| 楼宇的建筑 | 8 | 4.1 | 0.7 | |
| 修理 - 其他 | 5 | 5.0 | 0.5 | |
| 儿童保育和日托 | 5 | 20.5年 | 3.7 | 0.5 |
| 地毯清洗 | 5 | 3.7 | 0.5 | |
| 洗衣店 | 6 | 4.2 | 0.6 | |
| 自助式仓储 | 7 | 30.8年 | 4.3 | 0.7 |
| 健康和医疗 | 15 | 3.9 | 1.4 | |
| 内科医生与外科医生 | 6 | 1.0 | 0.6 | |
| 牙科医生 | 6 | 4.9 | 0.6 | |
| 宠物美容和寄宿 | 6 | 20.1年 | 4.8 | 0.6 |
| 科学和技术服务 | 9 | 0.8 | ||
| 教堂 | 13 | 44.7年 | 4.6 | 1.2 |
| 美国餐馆 | 5 | 26.5年 | 4.2 | 0.5 |
| 二手店 | 6 | 3.7 | 0.6 | |
| 五金店 | 6 | 33年 | 0.6 | |
| 电子产品商店 | 7 | 33.5年 | 2.8 | 0.7 |
| 购物 - 其他 | 6 | 80.5年 | 3.3 | 0.6 |
| Dayton, 内华达州地区 | 31.74平方英里 |
| 人口 | 10755 |
| 男性人口 | 5362 (49.9%) |
| 女性人口 | 5393 (50.1%) |
| 从1975到2015的人口变化 | +317.5% |
| 从2000到2015的人口变化 | +82% |
| 年龄中位数 | 39 |
| 男性平均年龄 | 38.8 |
| 女性平均年龄 | 39.1 |
| 电话区号 | 775 |
| 邻近社区 | Dayton |
| 本地时间 | 星期六 22:57 |
| 时区 | 北美太平洋夏令时间 |
| 經度與緯度 | 39.23714° / -119.59295° |
| 邮政编码 | 89403 |
Dayton, 内华达州 -地图
Dayton, 内华达州人口
1975年到2015年| 数据 | 1975 | 1990 | 2000 | 2015 |
|---|---|---|---|---|
| 人口 | 2576 | 4319 | 5910 | 10755 |
| 人口密度 | 81.2 / mi² | 136.1 / mi² | 186.2 / mi² | 338.9 / mi² |
Dayton从2000到2015的人口变化
从2000年到2015年增长82%| 位置 | 1975以来的变化 | 1990以来的变化 | 2000以来的变化 |
|---|---|---|---|
| Dayton, 内华达州 | +317.5% | +149% | +82% |
| 内华达州 | +240.2% | +114.5% | +55.2% |
| 美国 | +46.9% | +27.2% | +13.7% |
Dayton, 内华达州平均年龄
平均年龄:39年| 位置 | 年龄中位数 | 中位年龄(女) | 中位年龄(男) |
|---|---|---|---|
| Dayton, 内华达州 | 39年 | 39.1年 | 38.8年 |
| 内华达州 | 36.3年 | 36.9年 | 35.8年 |
| 美国 | 37.4年 | 38.7年 | 36.1年 |
Dayton, 内华达州人口树形图
年龄和性别的人口| 年龄 | 男性 | 女性 | 总 |
|---|---|---|---|
| 5岁以下 | 355 | 355 | 710 |
| 5-9 | 416 | 365 | 782 |
| 10-14 | 432 | 381 | 814 |
| 15-19 | 356 | 372 | 728 |
| 20-24 | 279 | 280 | 559 |
| 25-29 | 287 | 335 | 622 |
| 30-34 | 303 | 312 | 616 |
| 35-39 | 330 | 364 | 695 |
| 40-44 | 393 | 375 | 768 |
| 45-49 | 390 | 431 | 822 |
| 50-54 | 361 | 411 | 772 |
| 55-59 | 357 | 371 | 729 |
| 60-64 | 351 | 302 | 653 |
| 65-69 | 315 | 282 | 597 |
| 70-74 | 181 | 183 | 365 |
| 75-79 | 128 | 139 | 268 |
| 80-84 | 73 | 85 | 159 |
| 85加 | 55 | 49 | 105 |
Dayton, 内华达州人口密度
人口密度: 338.9 / mi²| 位置 | 人口 | 面积 | 人口密度 |
|---|---|---|---|
| Dayton, 内华达州 | 10755 | 31.74平方英里 | 338.9 / mi² |
| 内华达州 | 3.1 million | 110,572.6平方英里 | 28.2 / mi² |
| 美国 | 321.6 million | 3,796,761.2平方英里 | 84.7 / mi² |
Dayton, 内华达州的历史和预计人口
从1870到2100的估计人口Sources:
1. JRC (European Commission's Joint Research Centre) work on the GHS built-up grid
2. CIESIN (Center for International Earth Science Information Network)
3. [链接] Klein Goldewijk, K., Beusen, A., Doelman, J., and Stehfest, E.: Anthropogenic land use estimates for the Holocene – HYDE 3.2, Earth Syst. Sci. Data, 9, 927–953, https://doi.org/10.5194/essd-9-927-2017, 2017.
Dayton, 内华达州企业(按价格分布)
适中: 48.1%
不贵: 46.3%
贵: 5.6%
人类发展指数(HDI)
预期寿命,教育程度和人均收入的统计综合指数。Sources: [Link] Kummu, M., Taka, M. & Guillaume, J. Gridded global datasets for Gross Domestic Product and Human Development Index over 1990–2015. Sci Data 5, 180004 (2018) doi:10.1038/sdata.2018.4
Dayton, 内华达州二氧化碳排放
每年人均二氧化碳(CO2)排放量(吨)| 位置 | 二氧化碳排放量 | 人均二氧化碳排放量 | 二氧化碳排放强度 |
|---|---|---|---|
| Dayton, 内华达州 | 186,045 tn | 17.3 tn | 5,861 tn/mi² |
| 内华达州 | 55,621,449 tn | 17.8 tn | 503 tn/mi² |
| 美国 | 5,664,619,809 tn | 17.6 tn | 1,491 tn/mi² |
Dayton, 内华达州二氧化碳排放
| 2013年二氧化碳排放量(吨/年) | 186,045 tn |
| 2013人均二氧化碳排放量(吨/年) | 17.3 tn |
| 2013二氧化碳排放强度(吨/平方英里/年) |
自然灾害风险
相对风险(满分10分)| 滑坡 | 平均值(6) |
| 干旱 | 高(9) |
| 洪水 | 平均值(4) |
| 地震 | 高(7.3) |
*风险可能并不涉及整个地区,尤其是洪水或山体滑坡。
Sources: 1. Dilley, M., R.S. Chen, U. Deichmann, A.L. Lerner-Lam, M. Arnold, J. Agwe, P. Buys, O. Kjekstad, B. Lyon, and G. Yetman. 2005. Natural Disaster Hotspots: A Global Risk Analysis. Washington, D.C.: World Bank. https://doi.org/10.1596/0-8213-5930-4.
2. Center for Hazards and Risk Research - CHRR - Columbia University, Center for International Earth Science Information Network - CIESIN - Columbia University. 2005. Global Earthquake Hazard Distribution - Peak Ground Acceleration. Palisades, NY: NASA Socioeconomic Data and Applications Center (SEDAC). https://doi.org/10.7927/H4BZ63ZS.
3. Center for Hazards and Risk Research - CHRR - Columbia University, Center for International Earth Science Information Network - CIESIN - Columbia University, and Norwegian Geotechnical Institute - NGI. 2005. Global Landslide Hazard Distribution. Palisades, NY: NASA Socioeconomic Data and Applications Center (SEDAC). https://doi.org/10.7927/H4P848VZ.
4. Center for Hazards and Risk Research - CHRR - Columbia University, Center for International Earth Science Information Network - CIESIN - Columbia University, and International Research Institute for Climate and Society - IRI - Columbia University. 2005. Global Drought Hazard Frequency and Distribution. Palisades, NY: NASA Socioeconomic Data and Applications Center (SEDAC). https://doi.org/10.7927/H4VX0DFT.
5. Center for Hazards and Risk Research - CHRR - Columbia University, Center for International Earth Science Information Network - CIESIN - Columbia University. 2005. Global Flood Hazard Frequency and Distribution. Palisades, NY: NASA Socioeconomic Data and Applications Center (SEDAC). https://doi.org/10.7927/H4668B3D.
最近的附近地震
幅度3.0以上| 日期 | 时间 | 大小 | 距离 | 深度 | 位置 | 链接 |
|---|---|---|---|---|---|---|
| 2019/6/6 | 21:49 | 3.7 | 11.5公里 | 10,900米 | 8km SW of Virginia City, Nevada | usgs.gov |
| 2018/12/20 | 05:30 | 3.2 | 18.2公里 | 7,900米 | 5km ENE of Indian Hills, Nevada | usgs.gov |
| 2018/12/20 | 05:24 | 3.6 | 18.1公里 | 8,100米 | 5km ENE of Indian Hills, Nevada | usgs.gov |
| 2018/12/4 | 07:14 | 3.2 | 18公里 | 8,400米 | 5km NE of Indian Hills, Nevada | usgs.gov |
| 2016/7/31 | 12:00 | 3.1 | 25.2公里 | 6,700米 | 11km S of Sparks, Nevada | usgs.gov |
| 2015/12/22 | 23:05 | 3.1 | 27.5公里 | 9,600米 | 10km SSE of Reno, Nevada | usgs.gov |
| 2015/12/22 | 22:46 | 4.4 | 27.1公里 | 9,700米 | 11km SSE of Reno, Nevada | usgs.gov |
| 2015/12/22 | 22:22 | 3.2 | 27.3公里 | 9,200米 | 10km SSE of Reno, Nevada | usgs.gov |
| 2014/7/7 | 17:16 | 3.2 | 12.3公里 | 9,000米 | 5km NE of Carson City, Nevada | usgs.gov |
| 2014/1/30 | 03:22 | 3.1 | 20.6公里 | 9,300米 | 14km NNE of Virginia City, Nevada | usgs.gov |
查找Dayton, 内华达州附近的历史地震事件
最早日期 最新日期
幅度3.0以上 幅度4.0及更高 震级5.0以上
关于我们的数据
此页面上的数据是使用许多公共可用工具和资源估算的。它不提供任何保修,并且可能包含不正确的地方。使用风险自负。有关更多信息,请参见此处 。