- 世界
- »
- US
- »
- 密蘇里州
- »
- Chilhowee, 密蘇里州
在Chilhowee的企业
产业领域
行业分布 工业: 17.3%
教育: 16%
商场: 12%
国内服务: 12%
专业服务: 12%
食品: 9.3%
宗教: 5.3%
宠物: 4%
本地服务: 4%
金融服务: 4%
其他: 4%
| Chilhowee, 密蘇里州地区 | 0.378平方英里 |
| 人口 | 334 |
| 男性人口 | 164 (49.1%) |
| 女性人口 | 170 (50.9%) |
| 从1975到2015的人口变化 | +34.7% |
| 从2000到2015的人口变化 | +11.7% |
| 年龄中位数 | 35.3 |
| 男性平均年龄 | 34.7 |
| 女性平均年龄 | 35.9 |
| 电话区号 | 660 |
| 本地时间 | 星期六 23:57 |
| 时区 | 北美中部夏令时间 |
| 經度與緯度 | 38.5889° / -93.85438° |
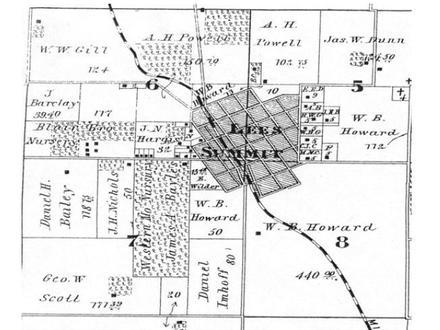
Chilhowee, 密蘇里州 -地图
Chilhowee, 密蘇里州人口
1975年到2015年| 数据 | 1975 | 1990 | 2000 | 2015 |
|---|---|---|---|---|
| 人口 | 248 | 279 | 299 | 334 |
| 人口密度 | 655.4 / mi² | 737.4 / mi² | 790.2 / mi² | 882.7 / mi² |
Chilhowee从2000到2015的人口变化
从2000年到2015年增长11.7%| 位置 | 1975以来的变化 | 1990以来的变化 | 2000以来的变化 |
|---|---|---|---|
| Chilhowee, 密蘇里州 | +34.7% | +19.7% | +11.7% |
| 密蘇里州 | +34.6% | +19.8% | +9.4% |
| 美国 | +46.9% | +27.2% | +13.7% |
Chilhowee, 密蘇里州平均年龄
平均年龄:35.3年| 位置 | 年龄中位数 | 中位年龄(女) | 中位年龄(男) |
|---|---|---|---|
| Chilhowee, 密蘇里州 | 35.3年 | 35.9年 | 34.7年 |
| 密蘇里州 | 38年 | 39.3年 | 36.6年 |
| 美国 | 37.4年 | 38.7年 | 36.1年 |
Chilhowee, 密蘇里州人口树形图
年龄和性别的人口| 年龄 | 男性 | 女性 | 总 |
|---|---|---|---|
| 5岁以下 | 11 | 10 | 21 |
| 5-9 | 24 | 18 | 42 |
| 10-14 | 10 | 14 | 25 |
| 15-19 | 10 | 12 | 23 |
| 20-24 | 10 | 10 | 21 |
| 25-29 | 5 | 9 | 14 |
| 30-34 | 13 | 11 | 25 |
| 35-39 | 12 | 8 | 20 |
| 40-44 | 12 | 15 | 27 |
| 45-49 | 11 | 11 | 22 |
| 50-54 | 13 | 12 | 25 |
| 55-59 | 11 | 8 | 20 |
| 60-64 | 3 | 3 | 6 |
| 65-69 | 4 | 5 | 9 |
| 70-74 | 3 | 8 | 12 |
| 75-79 | 4 | 5 | 10 |
| 80-84 | 5 | 6 | 11 |
| 85加 | 3 | 7 | 10 |
Chilhowee, 密蘇里州人口密度
人口密度: 882.7 / mi²| 位置 | 人口 | 面积 | 人口密度 |
|---|---|---|---|
| Chilhowee, 密蘇里州 | 334 | 0.378平方英里 | 882.7 / mi² |
| 密蘇里州 | 6.2 million | 69,707.3平方英里 | 88.3 / mi² |
| 美国 | 321.6 million | 3,796,761.2平方英里 | 84.7 / mi² |
Chilhowee, 密蘇里州的预计人口
从1975到2100的估计人口Sources:
1. JRC (European Commission's Joint Research Centre) work on the GHS built-up grid
2. CIESIN (Center for International Earth Science Information Network)
3. [链接] Klein Goldewijk, K., Beusen, A., Doelman, J., and Stehfest, E.: Anthropogenic land use estimates for the Holocene – HYDE 3.2, Earth Syst. Sci. Data, 9, 927–953, https://doi.org/10.5194/essd-9-927-2017, 2017.
区号
Chilhowee的企业使用的区号百分比 电话区号 660: 94.3%
电话区号 816: 2.9%
电话区号 913: 2.9%
人类发展指数(HDI)
预期寿命,教育程度和人均收入的统计综合指数。Sources: [Link] Kummu, M., Taka, M. & Guillaume, J. Gridded global datasets for Gross Domestic Product and Human Development Index over 1990–2015. Sci Data 5, 180004 (2018) doi:10.1038/sdata.2018.4
Chilhowee, 密蘇里州二氧化碳排放
每年人均二氧化碳(CO2)排放量(吨)| 位置 | 二氧化碳排放量 | 人均二氧化碳排放量 | 二氧化碳排放强度 |
|---|---|---|---|
| Chilhowee, 密蘇里州 | 6,406 tn | 19.2 tn | 16,930 tn/mi² |
| 密蘇里州 | 118,252,282 tn | 19.2 tn | 1,696 tn/mi² |
| 美国 | 5,664,619,809 tn | 17.6 tn | 1,491 tn/mi² |
Chilhowee, 密蘇里州二氧化碳排放
| 2013年二氧化碳排放量(吨/年) | 6,406 tn |
| 2013人均二氧化碳排放量(吨/年) | 19.2 tn |
| 2013二氧化碳排放强度(吨/平方英里/年) |
自然灾害风险
相对风险(满分10分)| 洪水 | 平均值(4) |
*风险可能并不涉及整个地区,尤其是洪水或山体滑坡。
Sources: 1. Dilley, M., R.S. Chen, U. Deichmann, A.L. Lerner-Lam, M. Arnold, J. Agwe, P. Buys, O. Kjekstad, B. Lyon, and G. Yetman. 2005. Natural Disaster Hotspots: A Global Risk Analysis. Washington, D.C.: World Bank. https://doi.org/10.1596/0-8213-5930-4.
2. Center for Hazards and Risk Research - CHRR - Columbia University, Center for International Earth Science Information Network - CIESIN - Columbia University. 2005. Global Flood Hazard Frequency and Distribution. Palisades, NY: NASA Socioeconomic Data and Applications Center (SEDAC). https://doi.org/10.7927/H4668B3D.
最近的附近地震
幅度3.0以上

关于我们的数据
此页面上的数据是使用许多公共可用工具和资源估算的。它不提供任何保修,并且可能包含不正确的地方。使用风险自负。有关更多信息,请参见此处 。