- 世界
- »
- IT
- »
- 托斯卡纳
- »
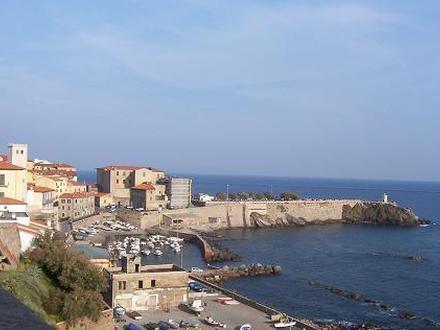
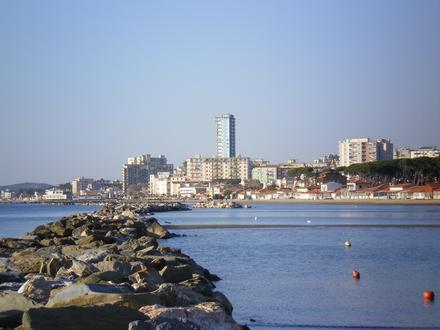
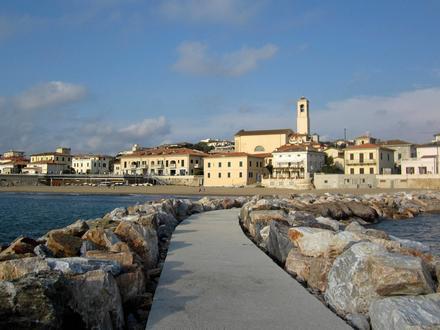
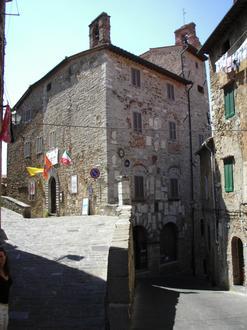
- Venturina, 托斯卡纳
在Venturina的企业
| Venturina, 托斯卡纳地区 | 3.59平方公里 |
| 人口 | 8816 |
| 男性人口 | 4288 (48.6%) |
| 女性人口 | 4528 (51.4%) |
| 从1975到2015的人口变化 | +16.4% |
| 从2000到2015的人口变化 | +6% |
| 年龄中位数 | 42.4 |
| 男性平均年龄 | 41.5 |
| 女性平均年龄 | 43.2 |
| 本地时间 | 星期日 06:59 |
| 时区 | 中欧夏令时间 |
| 經度與緯度 | 43.02883° / 10.60147° |
| 邮政编码 | 57029 |
Venturina, 托斯卡纳 -地图
Venturina, 托斯卡纳人口
1975年到2015年| 数据 | 1975 | 1990 | 2000 | 2015 |
|---|---|---|---|---|
| 人口 | 7575 | 8126 | 8316 | 8816 |
| 人口密度 | 2110 / km² | 2263 / km² | 2316 / km² | 2455 / km² |
Venturina从2000到2015的人口变化
从2000年到2015年增长6%| 位置 | 1975以来的变化 | 1990以来的变化 | 2000以来的变化 |
|---|---|---|---|
| Venturina, 托斯卡纳 | +16.4% | +8.5% | +6% |
| Livorno | +4.3% | +1.5% | +2.1% |
| 意大利 | +8.3% | +4.9% | +4.7% |
Venturina, 托斯卡纳平均年龄
平均年龄:42.4年| 位置 | 年龄中位数 | 中位年龄(女) | 中位年龄(男) |
|---|---|---|---|
| Venturina, 托斯卡纳 | 42.4年 | 43.2年 | 41.5年 |
| Livorno | 43.4年 | 44.1年 | 42.7年 |
| 意大利 | 40.9年 | 41.5年 | 40.3年 |
Venturina, 托斯卡纳人口树形图
年龄和性别的人口| 年龄 | 男性 | 女性 | 总 |
|---|---|---|---|
| 5岁以下 | 224 | 236 | 461 |
| 5-9 | 218 | 214 | 433 |
| 10-14 | 213 | 199 | 413 |
| 15-19 | 185 | 166 | 352 |
| 20-24 | 227 | 187 | 414 |
| 25-29 | 233 | 253 | 486 |
| 30-34 | 303 | 321 | 625 |
| 35-39 | 410 | 398 | 808 |
| 40-44 | 429 | 454 | 883 |
| 45-49 | 397 | 389 | 786 |
| 50-54 | 325 | 304 | 629 |
| 55-59 | 265 | 327 | 593 |
| 60-64 | 271 | 360 | 631 |
| 65-69 | 255 | 333 | 588 |
| 70-74 | 334 | 387 | 721 |
| 75-79 | 0 | 0 | 0 |
| 80-84 | 0 | 0 | 0 |
| 85加 | 0 | 0 | 0 |
Venturina, 托斯卡纳人口密度
人口密度: 2455 / km²| 位置 | 人口 | 面积 | 人口密度 |
|---|---|---|---|
| Venturina, 托斯卡纳 | 8816 | 3.59平方公里 | 2455 / km² |
| Livorno | 333559 | 1,214.2平方公里 | 274.7 / km² |
| 意大利 | 59.3 million | 301,510.7平方公里 | 196.7 / km² |
Venturina, 托斯卡纳的历史和预计人口
至2100的估计古代人口Sources:
1. JRC (European Commission's Joint Research Centre) work on the GHS built-up grid
2. CIESIN (Center for International Earth Science Information Network)
3. [链接] Klein Goldewijk, K., Beusen, A., Doelman, J., and Stehfest, E.: Anthropogenic land use estimates for the Holocene – HYDE 3.2, Earth Syst. Sci. Data, 9, 927–953, https://doi.org/10.5194/essd-9-927-2017, 2017.
人类发展指数(HDI)
预期寿命,教育程度和人均收入的统计综合指数。Sources: [Link] Kummu, M., Taka, M. & Guillaume, J. Gridded global datasets for Gross Domestic Product and Human Development Index over 1990–2015. Sci Data 5, 180004 (2018) doi:10.1038/sdata.2018.4
Venturina, 托斯卡纳二氧化碳排放
每年人均二氧化碳(CO2)排放量(吨)| 位置 | 二氧化碳排放量 | 人均二氧化碳排放量 | 二氧化碳排放强度 |
|---|---|---|---|
| Venturina, 托斯卡纳 | 63,827 tn | 7.24 tn | 17,779 tn/km² |
| Livorno | 2,375,115 tn | 7.12 tn | 1,956 tn/km² |
| 意大利 | 399,008,504 tn | 6.73 tn | 1,323 tn/km² |
Venturina, 托斯卡纳二氧化碳排放
| 2013年二氧化碳排放量(吨/年) | 63,827 tn |
| 2013人均二氧化碳排放量(吨/年) | 7.24 tn |
| 2013二氧化碳排放强度(吨/平方公里/年) | 17,779 tn/km² |
自然灾害风险
相对风险(满分10分)| 地震 | 平均值(4) |
*风险可能并不涉及整个地区,尤其是洪水或山体滑坡。
Sources: 1. Dilley, M., R.S. Chen, U. Deichmann, A.L. Lerner-Lam, M. Arnold, J. Agwe, P. Buys, O. Kjekstad, B. Lyon, and G. Yetman. 2005. Natural Disaster Hotspots: A Global Risk Analysis. Washington, D.C.: World Bank. https://doi.org/10.1596/0-8213-5930-4.
2. Center for Hazards and Risk Research - CHRR - Columbia University, Center for International Earth Science Information Network - CIESIN - Columbia University. 2005. Global Earthquake Hazard Distribution - Peak Ground Acceleration. Palisades, NY: NASA Socioeconomic Data and Applications Center (SEDAC). https://doi.org/10.7927/H4BZ63ZS.
最近的附近地震
幅度3.0以上| 日期 | 时间 | 大小 | 距离 | 深度 | 位置 | 链接 |
|---|---|---|---|---|---|---|
| 2018/4/30 | 22:16 | 4.1 | 42.1公里 | 10,000米 | 9km NNW of Chiusdino, Italy | usgs.gov |
| 2016/10/25 | 09:53 | 4.2 | 73.2公里 | 10,000米 | 5km NNE of Certaldo, Italy | usgs.gov |
| 2013/10/19 | 05:29 | 3.4 | 76.5公里 | 9,900米 | 5km NNW of Tirrenia, Italy | usgs.gov |
| 2008/2/16 | 14:12 | 3.1 | 16.5公里 | 16,200米 | central Italy | usgs.gov |
| 2007/11/3 | 15:08 | 3.2 | 35.5公里 | 5,200米 | central Italy | usgs.gov |
| 2006/4/17 | 14:42 | 4 | 72.9公里 | 9,100米 | central Italy | usgs.gov |
| 2005/5/16 | 18:04 | 3.1 | 72.2公里 | 2,600米 | central Italy | usgs.gov |
| 2005/5/16 | 17:32 | 3.8 | 72.1公里 | 1,200米 | central Italy | usgs.gov |
| 2005/4/9 | 14:59 | 3.1 | 29.2公里 | 7,900米 | central Italy | usgs.gov |
| 2005/4/9 | 13:59 | 3.2 | 29.1公里 | 8,000米 | central Italy | usgs.gov |
查找Venturina, 托斯卡纳附近的历史地震事件
最早日期 最新日期
幅度3.0以上 幅度4.0及更高 震级5.0以上
关于我们的数据
此页面上的数据是使用许多公共可用工具和资源估算的。它不提供任何保修,并且可能包含不正确的地方。使用风险自负。有关更多信息,请参见此处 。