- 世界
- »
- IL
- »
- 北部区 (以色列)
- »
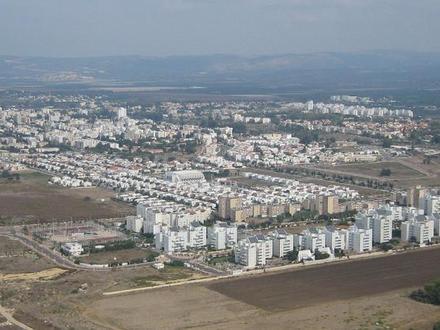
- Shelomi, 北部区 (以色列)
在Shelomi的企业
产业领域
行业分布 商场: 16.7%
工业: 10.1%
餐馆: 9.5%
专业服务: 9.5%
食品: 7.7%
医疗: 7.7%
酒店与旅游: 7.1%
美容与水疗: 5.9%
其他: 25.8%
| 行业说明 | 机构数 | Google平均评分 | 每千名居民的业务 |
|---|---|---|---|
| 健康和医疗 | 10 | 4.3 | 1.6 |
| Shelomi, 北部区 (以色列)地区 | 5.9平方公里 |
| 人口 | 6273 |
| 男性人口 | 3113 (49.6%) |
| 女性人口 | 3160 (50.4%) |
| 从1975到2015的人口变化 | +173.2% |
| 从2000到2015的人口变化 | +25.2% |
| 年龄中位数 | 32.1 |
| 男性平均年龄 | 31.2 |
| 女性平均年龄 | 33 |
| 电话区号 | 4 |
| 本地时间 | 星期五 06:02 |
| 时区 | 以色列夏令时间 |
| 經度與緯度 | 33.07216° / 35.14452° |
| 邮政编码 | 22832 |
Shelomi, 北部区 (以色列) -地图
Shelomi, 北部区 (以色列)人口
1975年到2015年| 数据 | 1975 | 1990 | 2000 | 2015 |
|---|---|---|---|---|
| 人口 | 2296 | 2812 | 5012 | 6273 |
| 人口密度 | 391.3 / km² | 479.2 / km² | 854.1 / km² | 1069 / km² |
Shelomi从2000到2015的人口变化
从2000年到2015年增长25.2%| 位置 | 1975以来的变化 | 1990以来的变化 | 2000以来的变化 |
|---|---|---|---|
| Shelomi, 北部区 (以色列) | +173.2% | +123.1% | +25.2% |
| Northern | +142.6% | +78.8% | +33.6% |
| 以色列 | +141.5% | +78.8% | +33.8% |
Shelomi, 北部区 (以色列)平均年龄
平均年龄:32.1年| 位置 | 年龄中位数 | 中位年龄(女) | 中位年龄(男) |
|---|---|---|---|
| Shelomi, 北部区 (以色列) | 32.1年 | 33年 | 31.2年 |
| Northern | 26.9年 | 27.7年 | 26.2年 |
| 以色列 | 29.6年 | 30.6年 | 28.5年 |
Shelomi, 北部区 (以色列)人口树形图
年龄和性别的人口| 年龄 | 男性 | 女性 | 总 |
|---|---|---|---|
| 5岁以下 | 280 | 269 | 550 |
| 5-9 | 281 | 259 | 541 |
| 10-14 | 247 | 234 | 481 |
| 15-19 | 253 | 238 | 491 |
| 20-24 | 222 | 209 | 431 |
| 25-29 | 215 | 218 | 434 |
| 30-34 | 249 | 256 | 505 |
| 35-39 | 227 | 231 | 458 |
| 40-44 | 193 | 193 | 387 |
| 45-49 | 181 | 183 | 365 |
| 50-54 | 181 | 186 | 367 |
| 55-59 | 165 | 167 | 332 |
| 60-64 | 131 | 132 | 264 |
| 65-69 | 81 | 92 | 173 |
| 70-74 | 75 | 95 | 170 |
| 75-79 | 59 | 76 | 135 |
| 80-84 | 43 | 66 | 110 |
| 85加 | 31 | 57 | 88 |
Shelomi, 北部区 (以色列)人口密度
人口密度: 1069 / km²| 位置 | 人口 | 面积 | 人口密度 |
|---|---|---|---|
| Shelomi, 北部区 (以色列) | 6273 | 5.9平方公里 | 1069 / km² |
| Northern | 1.4 million | 4,641.2平方公里 | 303.9 / km² |
| 以色列 | 8.3 million | 22,078平方公里 | 374.2 / km² |
Shelomi, 北部区 (以色列)的历史和预计人口
至2100的估计古代人口Sources:
1. JRC (European Commission's Joint Research Centre) work on the GHS built-up grid
2. CIESIN (Center for International Earth Science Information Network)
3. [链接] Klein Goldewijk, K., Beusen, A., Doelman, J., and Stehfest, E.: Anthropogenic land use estimates for the Holocene – HYDE 3.2, Earth Syst. Sci. Data, 9, 927–953, https://doi.org/10.5194/essd-9-927-2017, 2017.
区号
Shelomi的企业使用的区号百分比 电话区号 4: 45.1%
电话区号 52: 14.6%
电话区号 54: 14.6%
电话区号 50: 9.8%
电话区号 77: 7.3%
电话区号 53: 4.9%
其他: 3.7%
人类发展指数(HDI)
预期寿命,教育程度和人均收入的统计综合指数。Sources: [Link] Kummu, M., Taka, M. & Guillaume, J. Gridded global datasets for Gross Domestic Product and Human Development Index over 1990–2015. Sci Data 5, 180004 (2018) doi:10.1038/sdata.2018.4
Shelomi, 北部区 (以色列)二氧化碳排放
每年人均二氧化碳(CO2)排放量(吨)| 位置 | 二氧化碳排放量 | 人均二氧化碳排放量 | 二氧化碳排放强度 |
|---|---|---|---|
| Shelomi, 北部区 (以色列) | 62,661 tn | 9.99 tn | 10,678 tn/km² |
| Northern | 11,734,869 tn | 8.32 tn | 2,528 tn/km² |
| 以色列 | 81,985,470 tn | 9.92 tn | 3,713 tn/km² |
Shelomi, 北部区 (以色列)二氧化碳排放
| 2013年二氧化碳排放量(吨/年) | 62,661 tn |
| 2013人均二氧化碳排放量(吨/年) | 9.99 tn |
| 2013二氧化碳排放强度(吨/平方公里/年) | 10,678 tn/km² |
自然灾害风险
相对风险(满分10分)| 干旱 | 高(9) |
| 洪水 | 高(7) |
| 地震 | 高(7) |
*风险可能并不涉及整个地区,尤其是洪水或山体滑坡。
Sources: 1. Dilley, M., R.S. Chen, U. Deichmann, A.L. Lerner-Lam, M. Arnold, J. Agwe, P. Buys, O. Kjekstad, B. Lyon, and G. Yetman. 2005. Natural Disaster Hotspots: A Global Risk Analysis. Washington, D.C.: World Bank. https://doi.org/10.1596/0-8213-5930-4.
2. Center for Hazards and Risk Research - CHRR - Columbia University, Center for International Earth Science Information Network - CIESIN - Columbia University. 2005. Global Earthquake Hazard Distribution - Peak Ground Acceleration. Palisades, NY: NASA Socioeconomic Data and Applications Center (SEDAC). https://doi.org/10.7927/H4BZ63ZS.
3. Center for Hazards and Risk Research - CHRR - Columbia University, Center for International Earth Science Information Network - CIESIN - Columbia University, and International Research Institute for Climate and Society - IRI - Columbia University. 2005. Global Drought Hazard Frequency and Distribution. Palisades, NY: NASA Socioeconomic Data and Applications Center (SEDAC). https://doi.org/10.7927/H4VX0DFT.
4. Center for Hazards and Risk Research - CHRR - Columbia University, Center for International Earth Science Information Network - CIESIN - Columbia University. 2005. Global Flood Hazard Frequency and Distribution. Palisades, NY: NASA Socioeconomic Data and Applications Center (SEDAC). https://doi.org/10.7927/H4668B3D.
最近的附近地震
幅度3.0以上| 日期 | 时间 | 大小 | 距离 | 深度 | 位置 | 链接 |
|---|---|---|---|---|---|---|
| 2018/11/3 | 10:42 | 3.8 | 70.2公里 | 32,140米 | 44km WNW of Sidon, Lebanon | usgs.gov |
| 2018/7/4 | 12:45 | 4.7 | 41.4公里 | 10,000米 | 5km SE of 'Eilabun, Israel | usgs.gov |
| 2018/7/3 | 18:50 | 4 | 41.9公里 | 10,000米 | 6km SSE of 'Eilabun, Israel | usgs.gov |
| 2016/6/29 | 06:24 | 3.7 | 81.7公里 | 13,850米 | 19km WSW of Beirut, Lebanon | usgs.gov |
| 2014/7/5 | 14:41 | 4 | 61.7公里 | 12,700米 | 3km NE of Sidon, Lebanon | usgs.gov |
| 2013/10/20 | 05:54 | 3.5 | 46.5公里 | 5,000米 | 8km NNE of Tiberias, Israel | usgs.gov |
| 2011/8/7 | 01:52 | 4.1 | 84.5公里 | 31,000米 | Dead Sea region | usgs.gov |
| 2009/7/10 | 11:19 | 4 | 32公里 | 10,000米 | Lebanon - Syria region | usgs.gov |
| 2008/8/12 | 23:05 | 3.2 | 55.6公里 | 10,000米 | eastern Mediterranean Sea | usgs.gov |
| 2008/7/2 | 02:29 | 3.1 | 55公里 | 20,100米 | Lebanon - Syria region | usgs.gov |
查找Shelomi, 北部区 (以色列)附近的历史地震事件
最早日期 最新日期
幅度3.0以上 幅度4.0及更高 震级5.0以上
关于我们的数据
此页面上的数据是使用许多公共可用工具和资源估算的。它不提供任何保修,并且可能包含不正确的地方。使用风险自负。有关更多信息,请参见此处 。