- 世界
- »
- GB
- »
- 北爱尔兰
- »
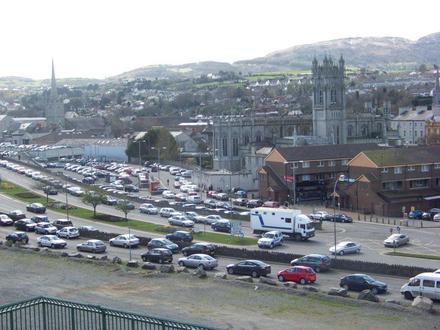
- Warrenpoint, 北爱尔兰
在Warrenpoint的企业
产业领域
行业分布 商场: 19.3%
餐馆: 11.2%
专业服务: 11.2%
工业: 9.5%
国内服务: 7.5%
食品: 6.6%
美容与水疗: 5.2%
酒店与旅游: 4.9%
其他: 24.7%
| Warrenpoint, 北爱尔兰地区 | 2.62平方公里 |
| 人口 | 5462 |
| 男性人口 | 2615 (47.9%) |
| 女性人口 | 2847 (52.1%) |
| 从1975到2015的人口变化 | +3.8% |
| 从2000到2015的人口变化 | +4.9% |
| 年龄中位数 | 38.3 |
| 男性平均年龄 | 37.4 |
| 女性平均年龄 | 39.2 |
| 本地时间 | 星期五 16:22 |
| 时区 | 英国夏令时间 |
| 經度與緯度 | 54.10148° / -6.25731° |
| 邮政编码 | BT34 |
Warrenpoint, 北爱尔兰 -地图
Warrenpoint, 北爱尔兰人口
1975年到2015年| 数据 | 1975 | 1990 | 2000 | 2015 |
|---|---|---|---|---|
| 人口 | 5260 | 5179 | 5207 | 5462 |
| 人口密度 | 2007 / km² | 1976 / km² | 1987 / km² | 2084 / km² |
Warrenpoint从2000到2015的人口变化
从2000年到2015年增长4.9%| 位置 | 1975以来的变化 | 1990以来的变化 | 2000以来的变化 |
|---|---|---|---|
| Warrenpoint, 北爱尔兰 | +3.8% | +5.5% | +4.9% |
| Newry and Mourne | +42.5% | +31.2% | +20.9% |
| 英国 | +15.2% | +13.3% | +9.9% |
Warrenpoint, 北爱尔兰平均年龄
平均年龄:38.3年| 位置 | 年龄中位数 | 中位年龄(女) | 中位年龄(男) |
|---|---|---|---|
| Warrenpoint, 北爱尔兰 | 38.3年 | 39.2年 | 37.4年 |
| Newry and Mourne | 34.8年 | 35.5年 | 34.1年 |
| 英国 | 39.6年 | 40.6年 | 38.5年 |
Warrenpoint, 北爱尔兰人口树形图
年龄和性别的人口| 年龄 | 男性 | 女性 | 总 |
|---|---|---|---|
| 5岁以下 | 175 | 156 | 332 |
| 5-9 | 167 | 159 | 326 |
| 10-14 | 180 | 206 | 386 |
| 15-19 | 185 | 182 | 367 |
| 20-24 | 168 | 172 | 341 |
| 25-29 | 180 | 202 | 382 |
| 30-34 | 166 | 186 | 352 |
| 35-39 | 181 | 192 | 374 |
| 40-44 | 185 | 176 | 362 |
| 45-49 | 198 | 210 | 409 |
| 50-54 | 180 | 210 | 390 |
| 55-59 | 160 | 162 | 323 |
| 60-64 | 148 | 146 | 295 |
| 65-69 | 109 | 132 | 242 |
| 70-74 | 95 | 130 | 226 |
| 75-79 | 66 | 88 | 155 |
| 80-84 | 41 | 80 | 122 |
| 85加 | 29 | 58 | 87 |
Warrenpoint, 北爱尔兰人口密度
人口密度: 2084 / km²| 位置 | 人口 | 面积 | 人口密度 |
|---|---|---|---|
| Warrenpoint, 北爱尔兰 | 5462 | 2.62平方公里 | 2084 / km² |
| Newry and Mourne | 104210 | 901.5平方公里 | 115.6 / km² |
| 英国 | 64.5 million | 247,916.6平方公里 | 260.3 / km² |
Warrenpoint, 北爱尔兰的历史和预计人口
从800到2100的估计人口Sources:
1. JRC (European Commission's Joint Research Centre) work on the GHS built-up grid
2. CIESIN (Center for International Earth Science Information Network)
3. [链接] Klein Goldewijk, K., Beusen, A., Doelman, J., and Stehfest, E.: Anthropogenic land use estimates for the Holocene – HYDE 3.2, Earth Syst. Sci. Data, 9, 927–953, https://doi.org/10.5194/essd-9-927-2017, 2017.
区号
Warrenpoint的企业使用的区号百分比 电话区号 28: 88.4%
电话区号 75: 4.7%
电话区号 79: 4.7%
其他: 2.3%
Warrenpoint, 北爱尔兰企业(按价格分布)
不贵: 41.7%
适中: 33.3%
贵: 16.7%
非常贵: 8.3%
人类发展指数(HDI)
预期寿命,教育程度和人均收入的统计综合指数。Sources: [Link] Kummu, M., Taka, M. & Guillaume, J. Gridded global datasets for Gross Domestic Product and Human Development Index over 1990–2015. Sci Data 5, 180004 (2018) doi:10.1038/sdata.2018.4
Warrenpoint, 北爱尔兰二氧化碳排放
每年人均二氧化碳(CO2)排放量(吨)| 位置 | 二氧化碳排放量 | 人均二氧化碳排放量 | 二氧化碳排放强度 |
|---|---|---|---|
| Warrenpoint, 北爱尔兰 | 60,082 tn | 11 tn | 22,932 tn/km² |
| Newry and Mourne | 1,143,135 tn | 11 tn | 1,268 tn/km² |
| 英国 | 735,672,543 tn | 11.4 tn | 2,967 tn/km² |
Warrenpoint, 北爱尔兰二氧化碳排放
| 2013年二氧化碳排放量(吨/年) | 60,082 tn |
| 2013人均二氧化碳排放量(吨/年) | 11 tn |
| 2013二氧化碳排放强度(吨/平方公里/年) | 22,932 tn/km² |
自然灾害风险
相对风险(满分10分)| 洪水 | 平均值(4) |
*风险可能并不涉及整个地区,尤其是洪水或山体滑坡。
Sources: 1. Dilley, M., R.S. Chen, U. Deichmann, A.L. Lerner-Lam, M. Arnold, J. Agwe, P. Buys, O. Kjekstad, B. Lyon, and G. Yetman. 2005. Natural Disaster Hotspots: A Global Risk Analysis. Washington, D.C.: World Bank. https://doi.org/10.1596/0-8213-5930-4.
2. Center for Hazards and Risk Research - CHRR - Columbia University, Center for International Earth Science Information Network - CIESIN - Columbia University. 2005. Global Flood Hazard Frequency and Distribution. Palisades, NY: NASA Socioeconomic Data and Applications Center (SEDAC). https://doi.org/10.7927/H4668B3D.
关于我们的数据
此页面上的数据是使用许多公共可用工具和资源估算的。它不提供任何保修,并且可能包含不正确的地方。使用风险自负。有关更多信息,请参见此处 。