- 世界
- »
- CA
- »
- 薩斯喀徹溫
- »
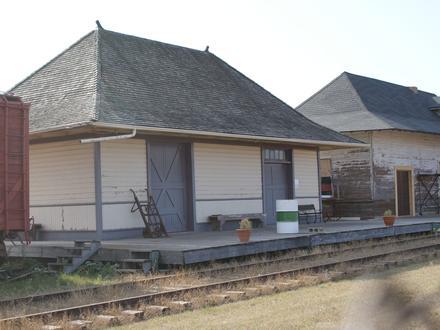
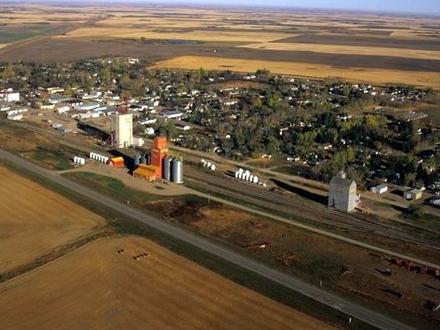
- Primate, 薩斯喀徹溫
在Primate的企业
| Primate, 薩斯喀徹溫地区 | 1.325平方公里 |
| 人口 | 48 |
| 从1975到2015的人口变化 | +33.3% |
| 从2000到2015的人口变化 | +9.1% |
| 电话区号 | 306 |
| 本地时间 | 星期四 21:00 |
| 时区 | 北美中部标准时间 |
| 經度與緯度 | 52.26684° / -109.81823° |
| 邮政编码 | S0L |
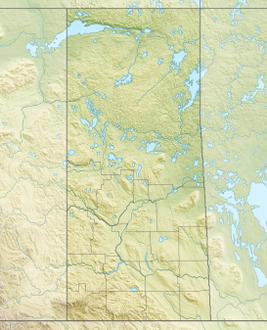
Primate, 薩斯喀徹溫 -地图
Primate, 薩斯喀徹溫人口
1975年到2015年| 数据 | 1975 | 1990 | 2000 | 2015 |
|---|---|---|---|---|
| 人口 | 36 | 41 | 44 | 48 |
| 人口密度 | 27.2 / km² | 30.9 / km² | 33.2 / km² | 36.2 / km² |
Primate从2000到2015的人口变化
从2000年到2015年增长9.1%| 位置 | 1975以来的变化 | 1990以来的变化 | 2000以来的变化 |
|---|---|---|---|
| Primate, 薩斯喀徹溫 | +33.3% | +17.1% | +9.1% |
| 薩斯喀徹溫 | +68.7% | +35.9% | +19.9% |
| 加拿大 | +55.8% | +30.2% | +17.2% |
Primate, 薩斯喀徹溫人口密度
人口密度: 36.2 / km²| 位置 | 人口 | 面积 | 人口密度 |
|---|---|---|---|
| Primate, 薩斯喀徹溫 | 48 | 1.325平方公里 | 36.2 / km² |
| 薩斯喀徹溫 | 1.1 million | 652,352.6平方公里 | 1.71 / km² |
| 加拿大 | 35.5 million | 9,875,295.4平方公里 | 3.6 / km² |
Primate, 薩斯喀徹溫的预计人口
从1975到2100的估计人口Sources:
1. JRC (European Commission's Joint Research Centre) work on the GHS built-up grid
2. CIESIN (Center for International Earth Science Information Network)
3. [链接] Klein Goldewijk, K., Beusen, A., Doelman, J., and Stehfest, E.: Anthropogenic land use estimates for the Holocene – HYDE 3.2, Earth Syst. Sci. Data, 9, 927–953, https://doi.org/10.5194/essd-9-927-2017, 2017.
人类发展指数(HDI)
预期寿命,教育程度和人均收入的统计综合指数。Sources: [Link] Kummu, M., Taka, M. & Guillaume, J. Gridded global datasets for Gross Domestic Product and Human Development Index over 1990–2015. Sci Data 5, 180004 (2018) doi:10.1038/sdata.2018.4
Primate, 薩斯喀徹溫二氧化碳排放
每年人均二氧化碳(CO2)排放量(吨)| 位置 | 二氧化碳排放量 | 人均二氧化碳排放量 | 二氧化碳排放强度 |
|---|---|---|---|
| Primate, 薩斯喀徹溫 | 681.6 tn | 14.2 tn | 514.3 tn/km² |
| 薩斯喀徹溫 | 14,964,194 tn | 13.4 tn | 22.9 tn/km² |
| 加拿大 | 521,999,336 tn | 14.7 tn | 52.9 tn/km² |
Primate, 薩斯喀徹溫二氧化碳排放
| 2013年二氧化碳排放量(吨/年) | 681.6 tn |
| 2013人均二氧化碳排放量(吨/年) | 14.2 tn |
| 2013二氧化碳排放强度(吨/平方公里/年) | 514.3 tn/km² |
自然灾害风险
相对风险(满分10分)| 干旱 | 高(7) |
*风险可能并不涉及整个地区,尤其是洪水或山体滑坡。
Sources: 1. Dilley, M., R.S. Chen, U. Deichmann, A.L. Lerner-Lam, M. Arnold, J. Agwe, P. Buys, O. Kjekstad, B. Lyon, and G. Yetman. 2005. Natural Disaster Hotspots: A Global Risk Analysis. Washington, D.C.: World Bank. https://doi.org/10.1596/0-8213-5930-4.
2. Center for Hazards and Risk Research - CHRR - Columbia University, Center for International Earth Science Information Network - CIESIN - Columbia University, and International Research Institute for Climate and Society - IRI - Columbia University. 2005. Global Drought Hazard Frequency and Distribution. Palisades, NY: NASA Socioeconomic Data and Applications Center (SEDAC). https://doi.org/10.7927/H4VX0DFT.
关于我们的数据
此页面上的数据是使用许多公共可用工具和资源估算的。它不提供任何保修,并且可能包含不正确的地方。使用风险自负。有关更多信息,请参见此处 。