- 世界
- »
- CA
- »
- 魁北克
- »
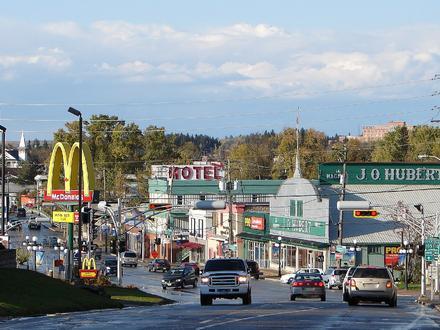
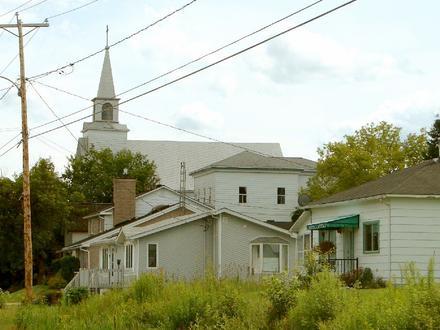
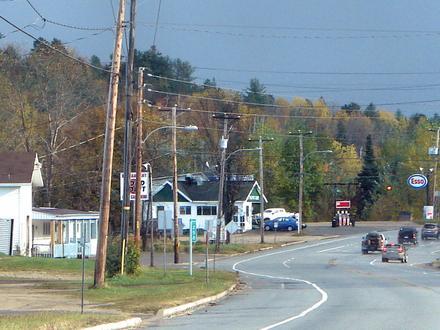
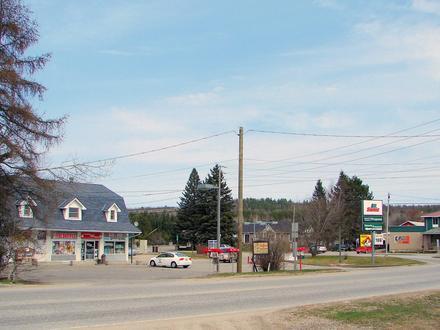
- Aumond, 魁北克
在Aumond的企业
产业领域
行业分布 酒店与旅游: 23.4%
食品: 10.6%
金融服务: 8.5%
宗教: 6.4%
汽车: 6.4%
餐馆: 6.4%
娱乐: 6.4%
体育与活动: 6.4%
工业: 4.3%
商场: 4.3%
教育: 4.3%
专业服务: 4.3%
其他: 8.5%
| Aumond, 魁北克地区 | 226.9平方公里 |
| 人口 | 752 |
| 男性人口 | 384 (51%) |
| 女性人口 | 368 (49%) |
| 从1975到2015的人口变化 | +3.3% |
| 从2000到2015的人口变化 | -1.2% |
| 年龄中位数 | 50 |
| 男性平均年龄 | 49.6 |
| 女性平均年龄 | 50.5 |
| 电话区号 | 819 |
| 本地时间 | 星期一 00:15 |
| 时区 | 北美东部夏令时间 |
| 經度與緯度 | 46.50011° / -75.83263° |
| 邮政编码 | J0W |
Aumond, 魁北克 -地图
Aumond, 魁北克人口
1975年到2015年| 数据 | 1975 | 1990 | 2000 | 2015 |
|---|---|---|---|---|
| 人口 | 728 | 759 | 761 | 752 |
| 人口密度 | 3.21 / km² | 3.35 / km² | 3.35 / km² | 3.31 / km² |
Aumond从2000到2015的人口变化
从2000年到2015年下降1.2%| 位置 | 1975以来的变化 | 1990以来的变化 | 2000以来的变化 |
|---|---|---|---|
| Aumond, 魁北克 | +3.3% | -0.9% | -1.2% |
| 魁北克 | +42.5% | +22.6% | +12.9% |
| 加拿大 | +55.8% | +30.2% | +17.2% |
Aumond, 魁北克平均年龄
平均年龄:50年| 位置 | 年龄中位数 | 中位年龄(女) | 中位年龄(男) |
|---|---|---|---|
| Aumond, 魁北克 | 50年 | 50.5年 | 49.6年 |
| 魁北克 | 42.2年 | 43.2年 | 41.1年 |
| 加拿大 | 40.6年 | 41.5年 | 39.6年 |
Aumond, 魁北克人口树形图
年龄和性别的人口| 年龄 | 男性 | 女性 | 总 |
|---|---|---|---|
| 5岁以下 | 10 | 16 | 27 |
| 5-9 | 15 | 16 | 32 |
| 10-14 | 20 | 16 | 37 |
| 15-19 | 31 | 11 | 42 |
| 20-24 | 10 | 11 | 22 |
| 25-29 | 15 | 11 | 27 |
| 30-34 | 11 | 16 | 27 |
| 35-39 | 20 | 16 | 37 |
| 40-44 | 26 | 21 | 47 |
| 45-49 | 36 | 47 | 83 |
| 50-54 | 31 | 42 | 73 |
| 55-59 | 46 | 42 | 88 |
| 60-64 | 41 | 31 | 73 |
| 65-69 | 36 | 31 | 67 |
| 70-74 | 15 | 21 | 37 |
| 75-79 | 10 | 10 | 21 |
| 80-84 | 5 | 5 | 11 |
| 85加 | 5 | 5 | 11 |
Aumond, 魁北克人口密度
人口密度: 3.31 / km²| 位置 | 人口 | 面积 | 人口密度 |
|---|---|---|---|
| Aumond, 魁北克 | 752 | 226.9平方公里 | 3.31 / km² |
| 魁北克 | 7.0 million | 1,519,626.9平方公里 | 4.6 / km² |
| 加拿大 | 35.5 million | 9,875,295.4平方公里 | 3.6 / km² |
人类发展指数(HDI)
预期寿命,教育程度和人均收入的统计综合指数。Sources: [Link] Kummu, M., Taka, M. & Guillaume, J. Gridded global datasets for Gross Domestic Product and Human Development Index over 1990–2015. Sci Data 5, 180004 (2018) doi:10.1038/sdata.2018.4
Aumond, 魁北克二氧化碳排放
每年人均二氧化碳(CO2)排放量(吨)| 位置 | 二氧化碳排放量 | 人均二氧化碳排放量 | 二氧化碳排放强度 |
|---|---|---|---|
| Aumond, 魁北克 | 9,937 tn | 13.2 tn | 43.8 tn/km² |
| 魁北克 | 96,902,370 tn | 13.9 tn | 63.8 tn/km² |
| 加拿大 | 521,999,336 tn | 14.7 tn | 52.9 tn/km² |
Aumond, 魁北克二氧化碳排放
| 2013年二氧化碳排放量(吨/年) | 9,937 tn |
| 2013人均二氧化碳排放量(吨/年) | 13.2 tn |
| 2013二氧化碳排放强度(吨/平方公里/年) | 43.8 tn/km² |
自然灾害风险
相对风险(满分10分)| 地震 | 平均值(6) |
*风险可能并不涉及整个地区,尤其是洪水或山体滑坡。
Sources: 1. Dilley, M., R.S. Chen, U. Deichmann, A.L. Lerner-Lam, M. Arnold, J. Agwe, P. Buys, O. Kjekstad, B. Lyon, and G. Yetman. 2005. Natural Disaster Hotspots: A Global Risk Analysis. Washington, D.C.: World Bank. https://doi.org/10.1596/0-8213-5930-4.
2. Center for Hazards and Risk Research - CHRR - Columbia University, Center for International Earth Science Information Network - CIESIN - Columbia University. 2005. Global Earthquake Hazard Distribution - Peak Ground Acceleration. Palisades, NY: NASA Socioeconomic Data and Applications Center (SEDAC). https://doi.org/10.7927/H4BZ63ZS.
最近的附近地震
幅度3.0以上| 日期 | 时间 | 大小 | 距离 | 深度 | 位置 | 链接 |
|---|---|---|---|---|---|---|
| 2019/7/13 | 10:56 | 3.7 | 83.2公里 | 15,010米 | 84km NW of Ferme-Neuve, Canada | usgs.gov |
| 2018/4/17 | 15:59 | 3.4 | 26.4公里 | 18,000米 | 12km W of Ferme-Neuve, Canada | usgs.gov |
| 2017/12/28 | 00:51 | 3.6 | 72.3公里 | 16,290米 | 76km WNW of Ferme-Neuve, Canada | usgs.gov |
| 2017/7/31 | 07:50 | 3.1 | 74.7公里 | 21,500米 | 30km NNE of Val-des-Monts, Canada | usgs.gov |
| 2016/6/19 | 16:07 | 3.3 | 20.4公里 | 18,000米 | 15km SSW of Mont-Laurier, Canada | usgs.gov |
| 2015/7/27 | 13:26 | 3.1 | 43公里 | 18,000米 | 16km E of Mont-Laurier, Canada | usgs.gov |
| 2013/5/17 | 13:15 | 3.1 | 90.6公里 | 18,000米 | 21km NNE of Shawville, Canada | usgs.gov |
| 2013/1/15 | 16:53 | 3.5 | 57.3公里 | 18,000米 | southern Quebec, Canada | usgs.gov |
| 2012/1/21 | 21:59 | 3.1 | 56.2公里 | 10,000米 | southern Quebec, Canada | usgs.gov |
| 2010/6/24 | 16:49 | 3.2 | 74公里 | 16,700米 | Ontario-Quebec border region, Canada | usgs.gov |
查找Aumond, 魁北克附近的历史地震事件
最早日期 最新日期
幅度3.0以上 幅度4.0及更高 震级5.0以上
关于我们的数据
此页面上的数据是使用许多公共可用工具和资源估算的。它不提供任何保修,并且可能包含不正确的地方。使用风险自负。有关更多信息,请参见此处 。