產業領域
Snowmass按行业的企业分布
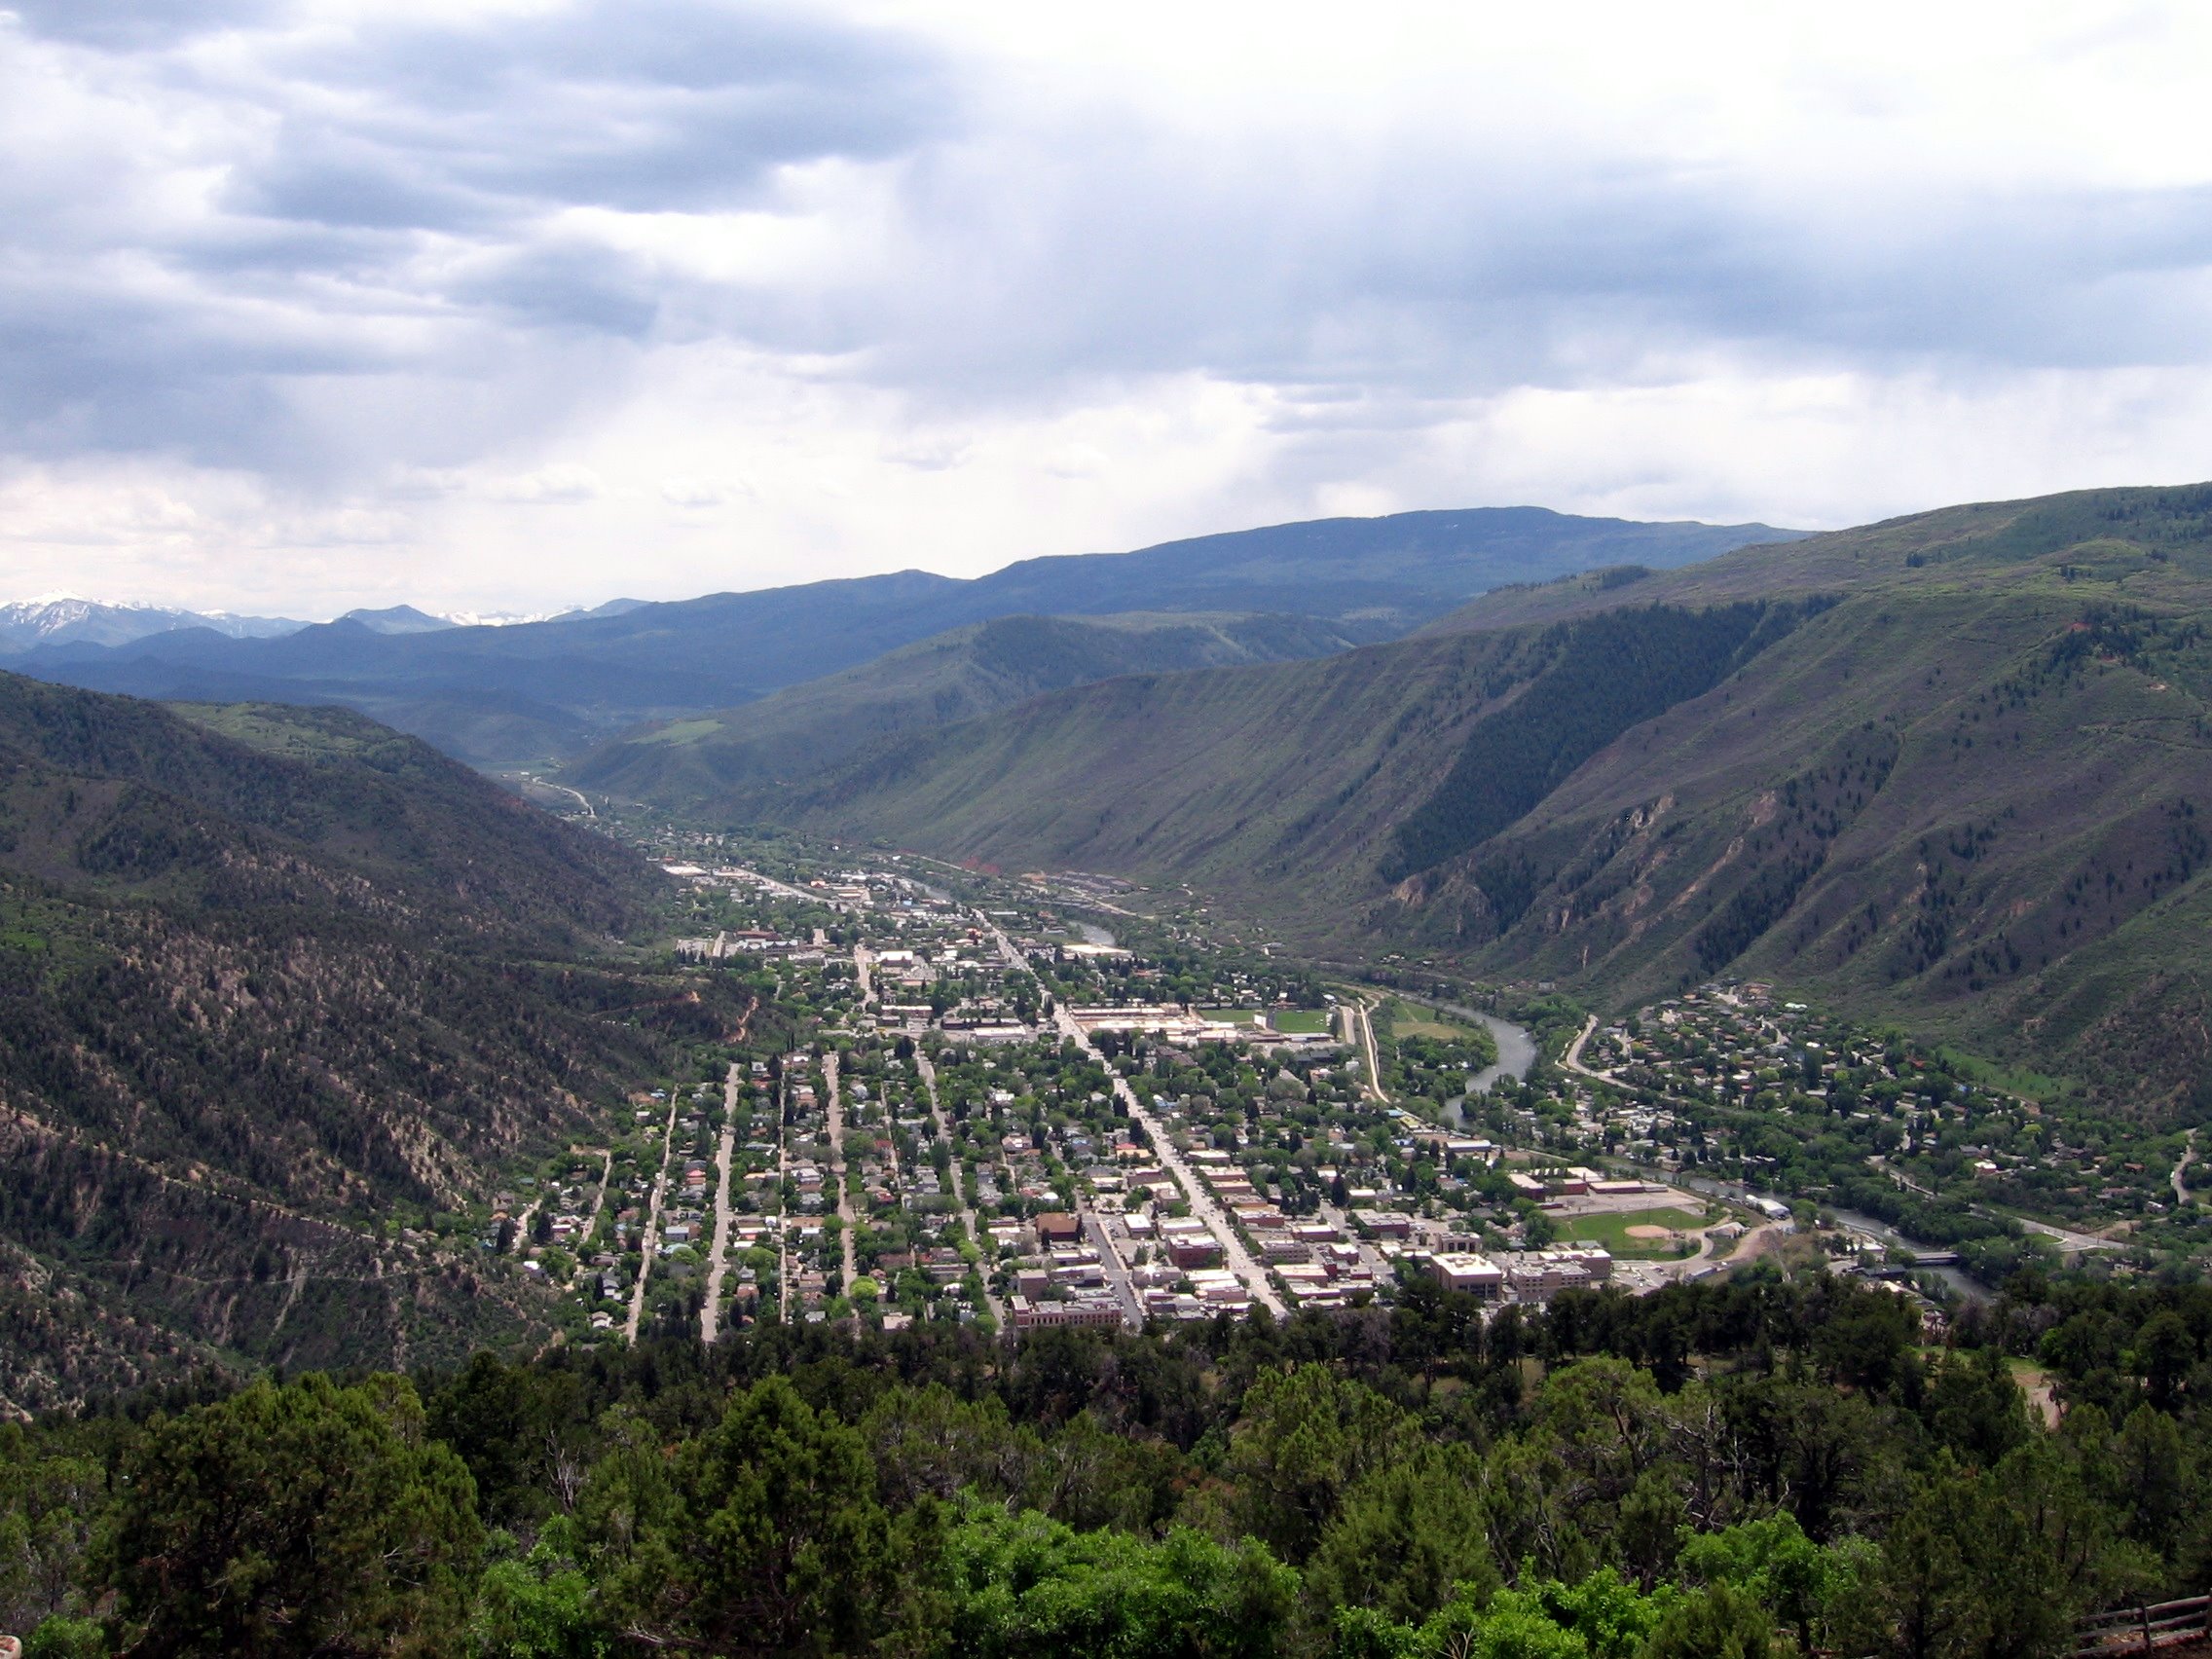
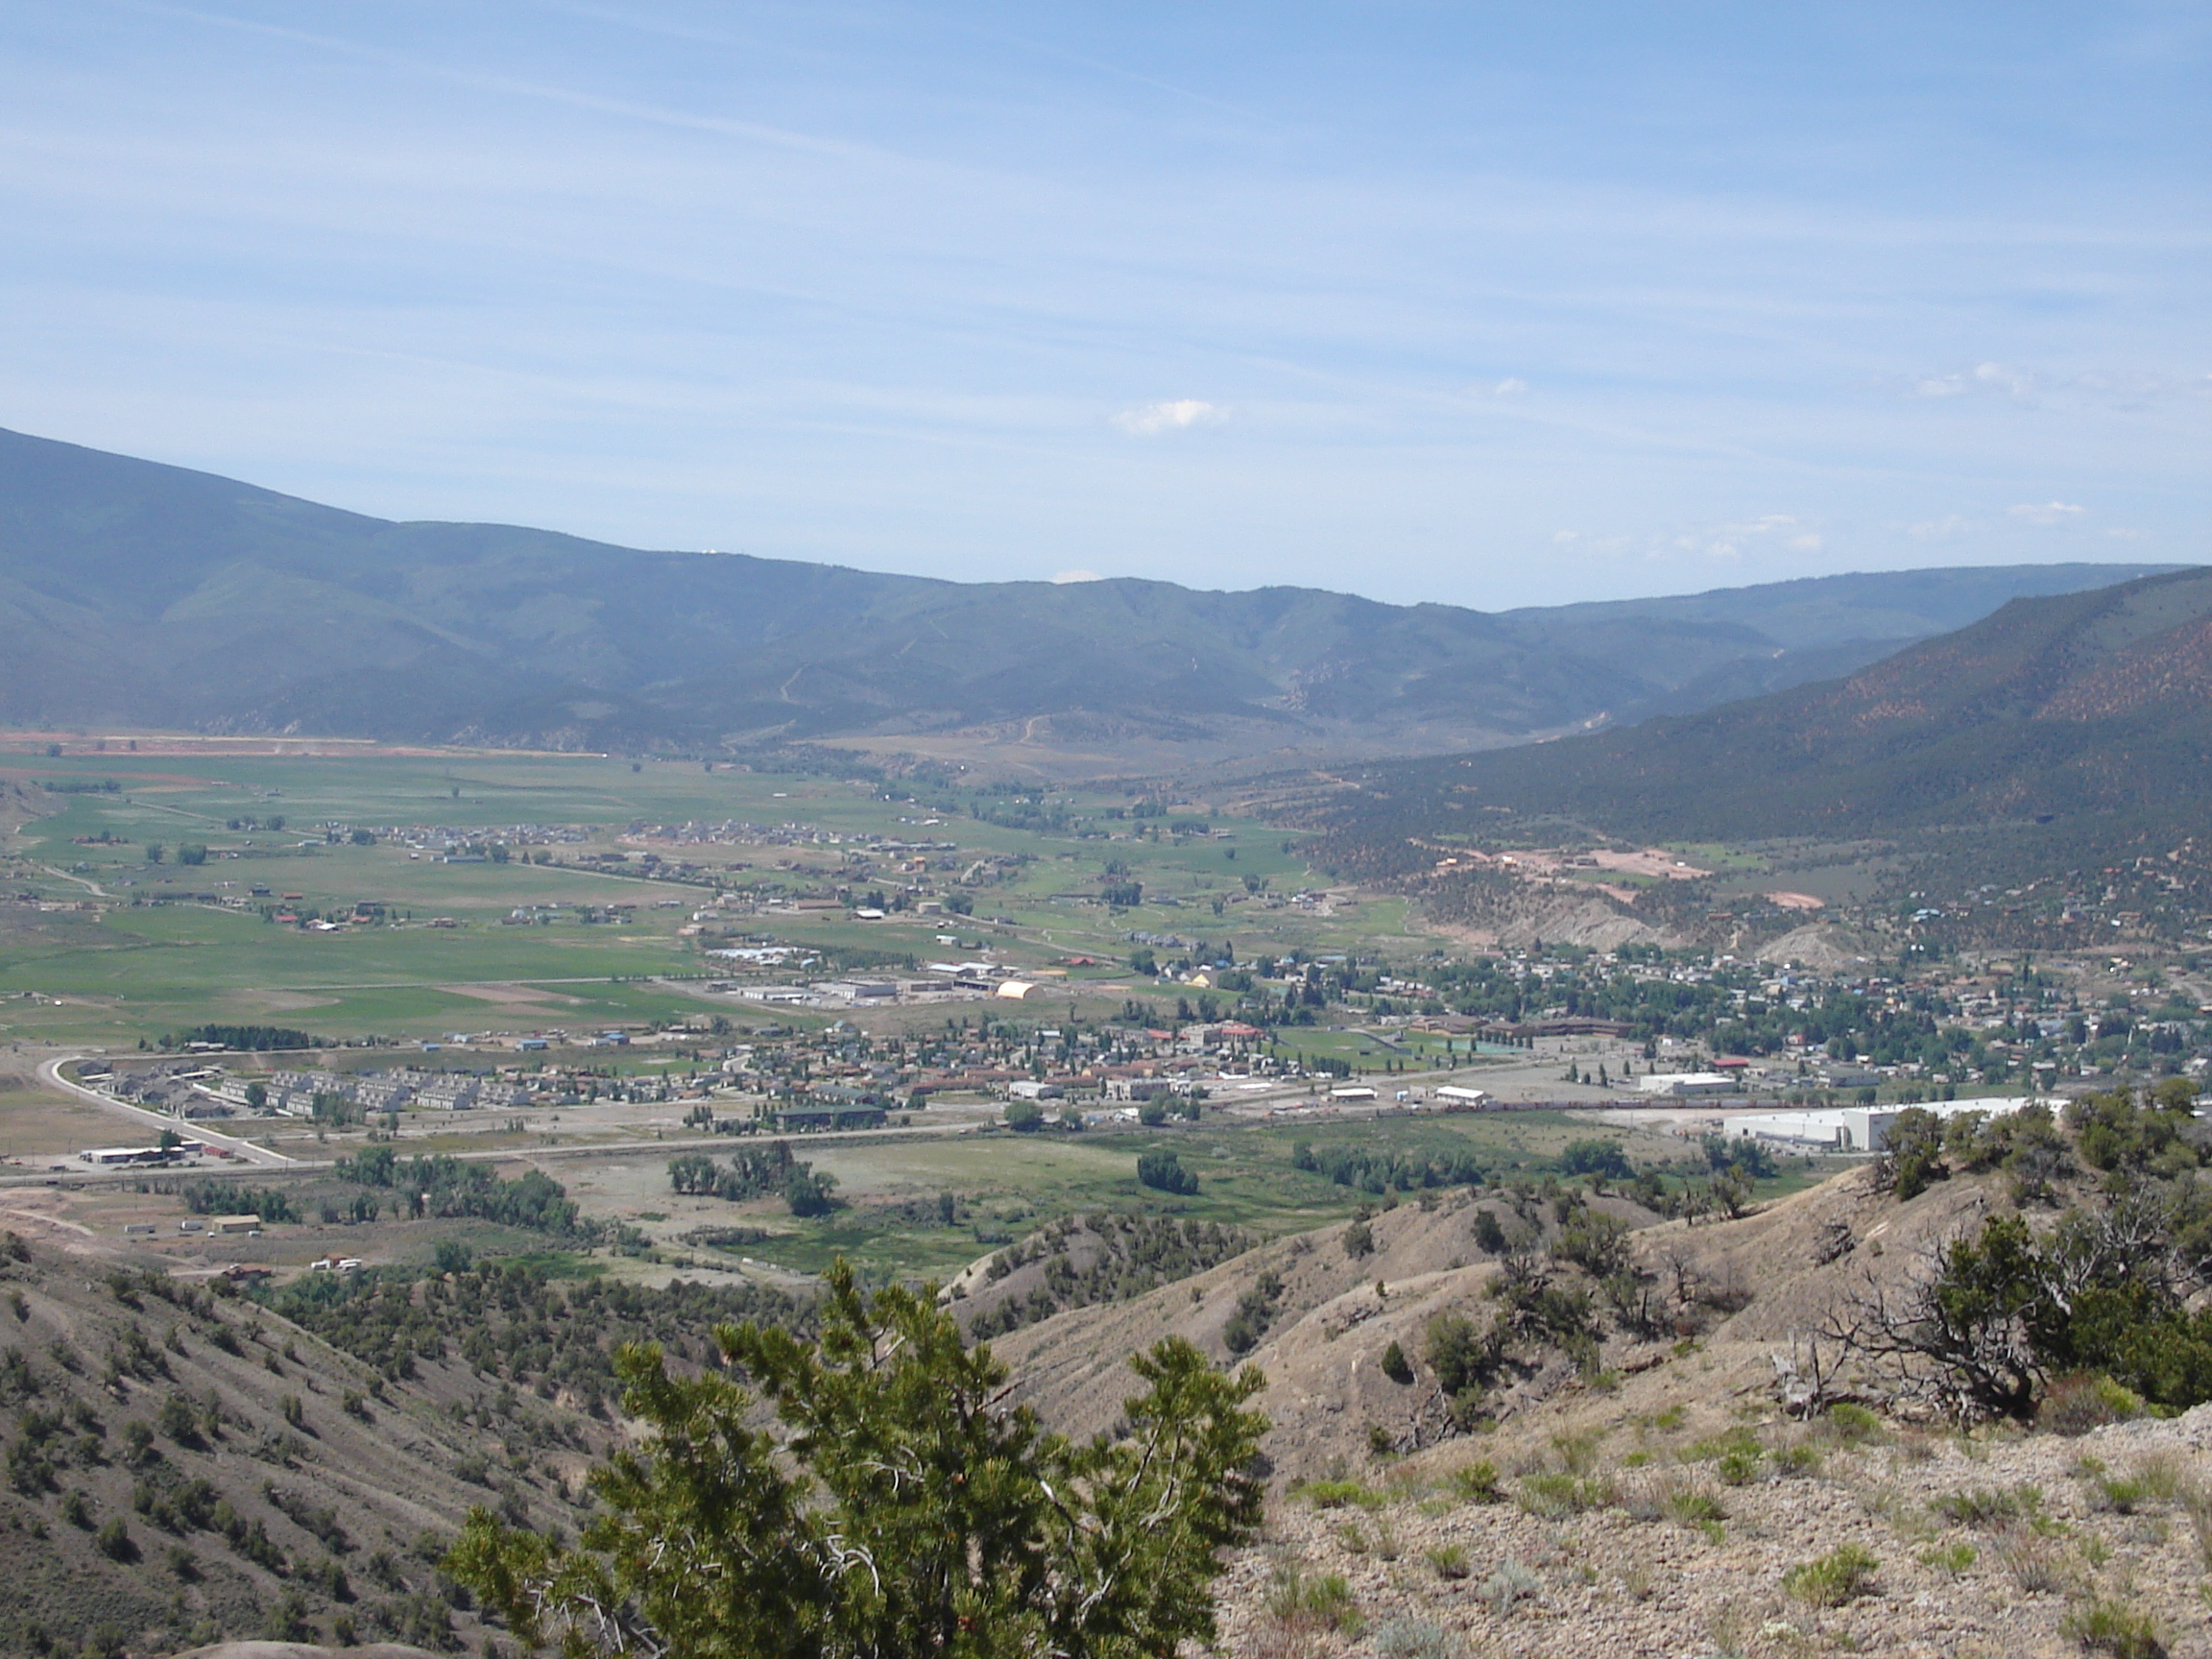
Snowmass的地圖
互動地圖
Snowmass的人口
1975年至2030年
| Data | 1975 | 1990 | 2000 | 2015 | 2020 | 2025* | 2030* |
|---|---|---|---|---|---|---|---|
| 人口 | 1,452 | 1,875 | 2,574 | 3,133 | 3,253 | 3,229 | 3,226 |
| 人口密度 | 52.7 / mi² | 68 / mi² | 93.4 / mi² | 113.7 / mi² | 118 / mi² | 117.2 / mi² | 117.1 / mi² |
* 预测
来源: JRC (European Commission's Joint Research Centre) 工作于 GHS built-up gridSnowmass从2000年到2020年的人口变化
从2000年到2020年增长了26.4%
| 位置 | 自1975以来的变化 | 自1990以来的变化 | 自2000以来的变化 |
|---|---|---|---|
| Snowmass | +124% | +73.5% | +26.4% |
| 科羅拉多州 | — | — | — |
| 美国 | — | — | — |
来源: JRC (European Commission's Joint Research Centre) 工作于 GHS built-up grid
Snowmass的中位年龄
中位年龄:40.7岁
| 位置 | 年齡中位數 | 中位年齡(女) | 中位年齡(男) |
|---|---|---|---|
| Snowmass | 40.7 yrs | 41.3 yrs | 40.3 yrs |
| 科羅拉多州 | 36.1 yrs | 37.1 yrs | 35.2 yrs |
| 美国 | 37.4 yrs | 38.7 yrs | 36.1 yrs |
来源: CIESIN (Center for International Earth Science Information Network)
Snowmass的人口密度
人口密度:118 / mi²
| 位置 | 人口 | 區 | 密度 |
|---|---|---|---|
| Snowmass | 3,253 | 27.56 sq mi | 118 / mi² |
| 科羅拉多州 | 5.4 million | 104,093.9 sq mi | 52 / mi² |
| 美国 | 321.6 million | 3,796,740.8 sq mi | 84.7 / mi² |
来源: JRC (European Commission's Joint Research Centre) 工作于 GHS built-up grid
Snowmass的历史和预测人口
从1880到2100的估计人口
来源:
- JRC (European Commission's Joint Research Centre) 工作于 GHS built-up grid
- CIESIN (Center for International Earth Science Information Network)
- [鏈接] Klein Goldewijk, K., Beusen, A., Doelman, J., and Stehfest, E.: Anthropogenic land use estimates for the Holocene – HYDE 3.2, Earth Syst. Sci. Data, 9, 927–953, https://doi.org/10.5194/essd-9-927-2017, 2017.
价格分布
Snowmass企業(按價格分佈)
人類發展指數(HDI)
預期壽命,教育程度和人均收入的統計綜合指數。
来源: [鏈接] Kummu, M., Taka, M. &Guillaume, J. Gridded global datasets for Gross Domestic Product and Human Development Index over 1990–2015. Sci Data 5, 180004 (2018) doi:10.1038/sdata.2018.4
Snowmass的國內生產毛額(GDP)
人均GDP,購買力平價(2017年不變國際元)
| Data | 1990 | 1995 | 2000 | 2005 | 2010 | 2015 | 2020 | 2022 |
|---|---|---|---|---|---|---|---|---|
| 人均GDP | $31,231 | $34,967 | $45,933 | $47,219 | $48,220 | $54,534 | $55,777 | $72,426 |
| GDP總量 | $8568.5万 | $1.1亿 | $1.7亿 | $1.8亿 | $2亿 | $2.5亿 | $2.6亿 | $3.4亿 |
来源: [鏈接] Kummu, M., Kosonen, M. & Masoumzadeh Sayyar, S. Downscaled gridded global dataset for gross domestic product (GDP) per capita PPP over 1990–2022. Sci Data 12, 178 (2025) doi:10.1038/s41597-025-04487-x
Snowmass的CO2排放
每年人均二氧化碳(CO2)排放量(噸)
| 位置 | 二氧化碳排放量 | 人均二氧化碳排放量 | 二氧化碳排放強度 |
|---|---|---|---|
| Snowmass | 110,037 tn | 33.83 tn | 3,992.9 tons/mi² |
| 科羅拉多州 | 108,781,948 tn | 20.11 tn | 1,045 tons/mi² |
| 美国 | 5,664,619,810 tn | 17.62 tn | 1,492 tons/mi² |
来源: [鏈接] Moran, D., Kanemoto K; Jiborn, M., Wood, R., Többen, J., and Seto, K.C. (2018) Carbon footprints of 13,000 cities. Environmental Research Letters DOI: 10.1088/1748-9326/aac72a
Snowmass的CO2排放
| 2013年CO2排放量(吨/年) | 110,037 tn |
| 2013年人均CO2排放量(吨/年) | 33.83 tn |
| 2013年CO2排放强度(吨/mi²/年) | 3,992.9 tons/mi² |
自然災害風險
相對風險(滿分10分)
| 危险 | 风险级别 |
|---|---|
| 乾旱 | 中等 (7) |
| 地震 | 低 (2.8) |
*風險可能並不涉及整個地區,尤其是洪水或山體滑坡。
来源:
- Dilley, M., R.S. Chen, U. Deichmann, A.L. Lerner-Lam, M. Arnold, J. Agwe, P. Buys, O. Kjekstad, B. Lyon, and G. Yetman. 2005. Natural Disaster Hotspots: A Global Risk Analysis. Washington, D.C.: World Bank. https://doi.org/10.1596/0-8213-5930-4.
- Center for Hazards and Risk Research - CHRR - Columbia University, Center for International Earth Science Information Network - CIESIN - Columbia University, and International Research Institute for Climate and Society - IRI - Columbia University. 2005. Global Drought Hazard Frequency and Distribution. Palisades, NY: NASA Socioeconomic Data and Applications Center (SEDAC). https://doi.org/10.7927/H4VX0DFT.
- Center for Hazards and Risk Research - CHRR - Columbia University, Center for International Earth Science Information Network - CIESIN - Columbia University. 2005. Global Earthquake Hazard Distribution - Peak Ground Acceleration. Palisades, NY: NASA Socioeconomic Data and Applications Center (SEDAC). https://doi.org/10.7927/H4BZ63ZS.
最近的附近地震
幅度3.0以上
| 日▼ | 時間↕ | Magnitude↕ | Distance↕ | 深度↕ | 位置↕ | 鏈接 |
|---|---|---|---|---|---|---|
| 2/1/19 | 8:58 AM | 3.1 | 41.4 km | 1,720 m | 3km NW of Glenwood Springs, Colorado | usgs.gov |
| 12/11/18 | 11:15 AM | 3.2 | 41.7 km | 5,000 m | 4km NNW of Glenwood Springs, Colorado | usgs.gov |
| 12/11/18 | 11:13 AM | 3.6 | 43.4 km | 1,130 m | 5km NNW of Glenwood Springs, Colorado | usgs.gov |
| 12/11/18 | 10:02 AM | 3.4 | 44.8 km | 3,830 m | 8km N of Glenwood Springs, Colorado | usgs.gov |
| 1/30/17 | 8:46 PM | 3.3 | 56.9 km | 5,000 m | 5km SW of New Castle, Colorado | usgs.gov |
| 7/24/16 | 4:47 AM | 3.4 | 65 km | 1,000 m | 8km NE of Paonia, Colorado | usgs.gov |
| 11/24/15 | 3:22 AM | 3.2 | 61.3 km | 1,000 m | 12km ENE of Paonia, Colorado | usgs.gov |
| 8/23/13 | 5:43 AM | 3 | 72.3 km | 1,000 m | 3km NNW of Paonia, Colorado | usgs.gov |
| 12/2/12 | 6:44 PM | 3.4 | 66.1 km | 1,000 m | Colorado | usgs.gov |
| 11/10/12 | 6:25 AM | 3 | 73.2 km | 1,000 m | Colorado | usgs.gov |

關於我們的數據
本页面上的数据是使用许多公开可用的工具和资源估算的。它不附带任何担保,可能包含不准确之处。使用风险自负。