Hemphill的类别
加油站卡车和拖车租赁汽车维修汽车配件城精品店供水与服务提供商县政府机关教堂浸信会社会服务组织一般承包商五金店住宅建筑室内施工承包商承包商楼宇的建筑油漆与油漆承包商自来水公司娱乐供应商摄影师旅游胜地快餐店杂货店和超市烘焙坊餐馆拖车租赁服务船只修理场草坪护理服务保险公司汇款服务法律服务自动取款机银行公墓内科医生与外科医生内科门诊部家庭保健服务牙科医生疗养院美发沙龙美容院美甲和修脚工业服务管理咨询公司房地产中介房地产经纪人房车营地私人屋苑一元店便利店批发商店礼品店钓鱼用品店公园小船停靠区船舶下水滑道野营地钓鱼营地住宿储存和入库小屋租赁代理床和早餐旅行社汽车旅馆自助式仓储货运代理货运公司货运/商业运输酒店旅馆
產業領域
Hemphill按行业的企业分布
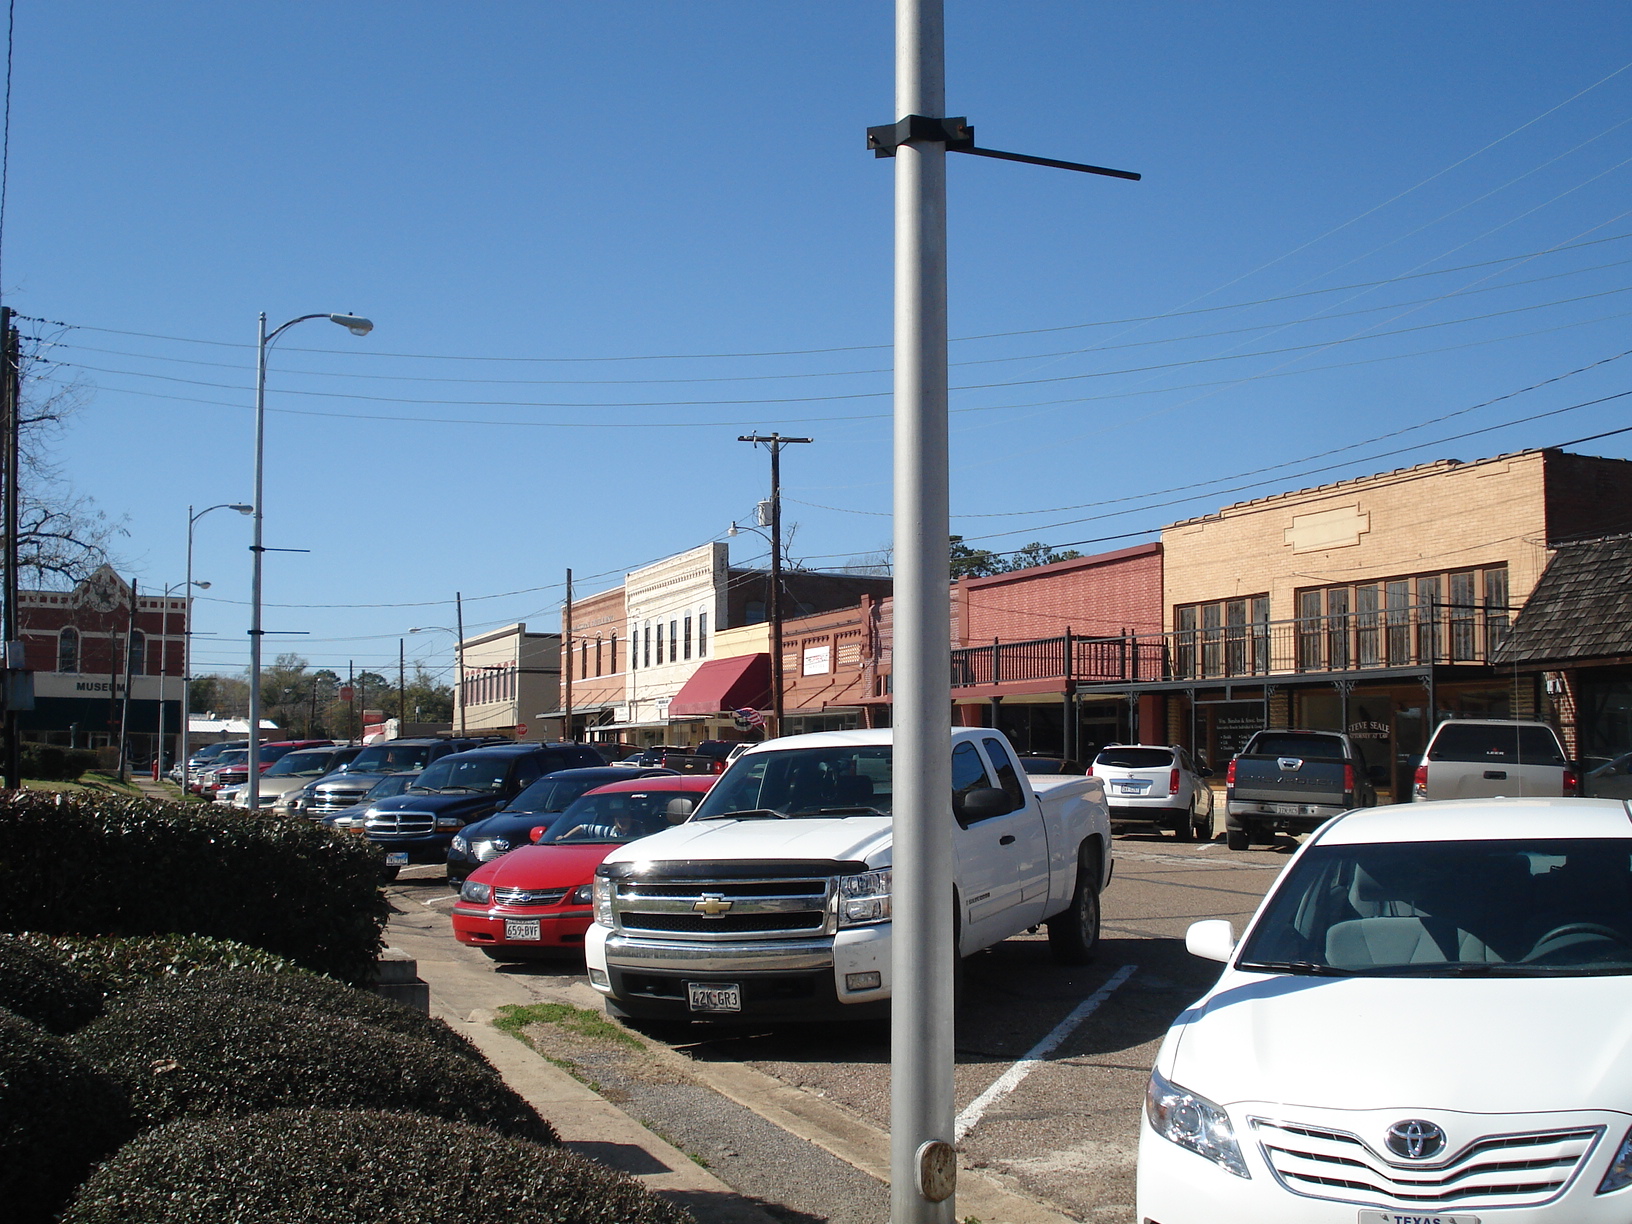
Hemphill的地圖
互動地圖
Hemphill的人口
1975年至2020年
| Data | 1975 | 1990 | 2000 | 2015 | 2020 |
|---|---|---|---|---|---|
| 人口 | 548 | 879 | 1,229 | 1,280 | 1,277 |
| 人口密度 | 212.2 / mi² | 340.4 / mi² | 476 / mi² | 495.7 / mi² | 494.6 / mi² |
来源: JRC (European Commission's Joint Research Centre) 工作于 GHS built-up grid
Hemphill从2000年到2015年的人口变化
从2000年到2015年增长了4.1%
| 位置 | 自1975以来的变化 | 自1990以来的变化 | 自2000以来的变化 |
|---|---|---|---|
| Hemphill | +133.6% | +45.6% | +4.1% |
| 德克萨斯州 | +111% | +60.8% | +31.3% |
| 美国 | +46.9% | +27.2% | +13.7% |
来源: JRC (European Commission's Joint Research Centre) 工作于 GHS built-up grid
Hemphill的中位年龄
中位年龄:43.1岁
| 位置 | 年齡中位數 | 中位年齡(女) | 中位年齡(男) |
|---|---|---|---|
| Hemphill | 43.1 yrs | 44.1 yrs | 42 yrs |
| 德克萨斯州 | 33.8 yrs | 34.8 yrs | 32.8 yrs |
| 美国 | 37.4 yrs | 38.7 yrs | 36.1 yrs |
来源: CIESIN (Center for International Earth Science Information Network)
Hemphill的人口密度
人口密度:495 / mi²
| 位置 | 人口 | 區 | 密度 |
|---|---|---|---|
| Hemphill | 1,277 | 2.582 sq mi | 495 / mi² |
| 德克萨斯州 | 27.5 million | 268,596.2 sq mi | 103 / mi² |
| 美国 | 321.6 million | 3,796,740.8 sq mi | 84.7 / mi² |
来源: JRC (European Commission's Joint Research Centre) 工作于 GHS built-up grid
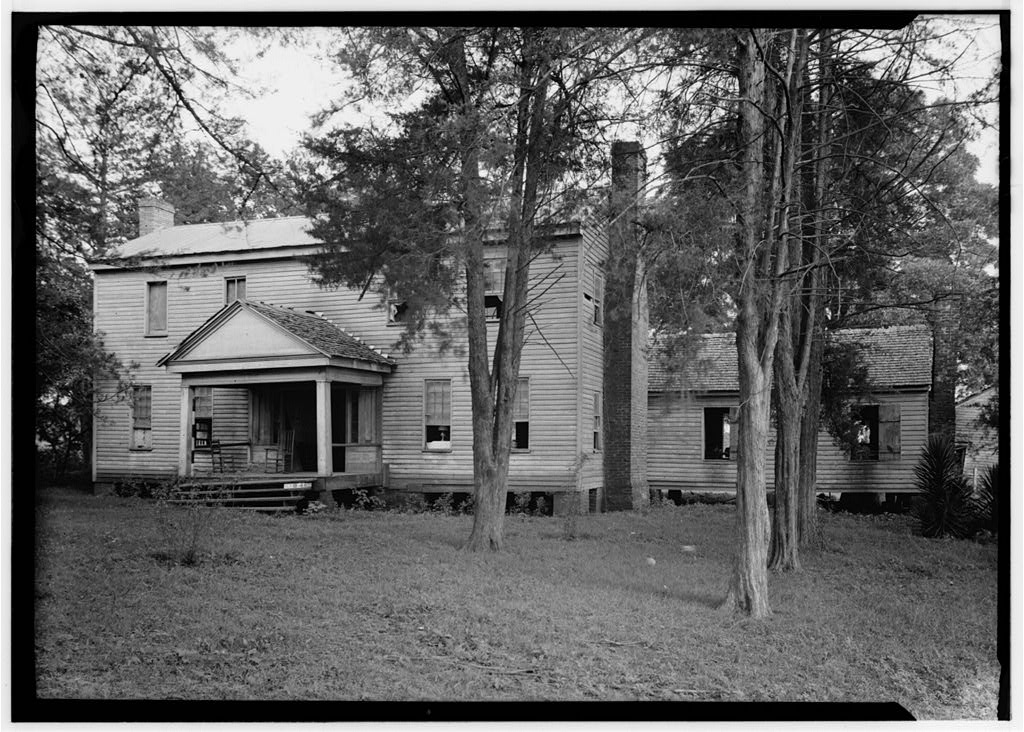
Hemphill的历史和预测人口
从1860到2100的估计人口
来源:
- JRC (European Commission's Joint Research Centre) 工作于 GHS built-up grid
- CIESIN (Center for International Earth Science Information Network)
- [鏈接] Klein Goldewijk, K., Beusen, A., Doelman, J., and Stehfest, E.: Anthropogenic land use estimates for the Holocene – HYDE 3.2, Earth Syst. Sci. Data, 9, 927–953, https://doi.org/10.5194/essd-9-927-2017, 2017.
价格分布
Hemphill企業(按價格分佈)
人類發展指數(HDI)
預期壽命,教育程度和人均收入的統計綜合指數。
来源: [鏈接] Kummu, M., Taka, M. &Guillaume, J. Gridded global datasets for Gross Domestic Product and Human Development Index over 1990–2015. Sci Data 5, 180004 (2018) doi:10.1038/sdata.2018.4
Hemphill的CO2排放
每年人均二氧化碳(CO2)排放量(噸)
| 位置 | 二氧化碳排放量 | 人均二氧化碳排放量 | 二氧化碳排放強度 |
|---|---|---|---|
| Hemphill | 36,200 tn | 28.35 tn | 14,019.7 tons/mi² |
| 德克萨斯州 | 488,896,034 tn | 17.76 tn | 1,820.2 tons/mi² |
| 美国 | 5,664,619,810 tn | 17.62 tn | 1,492 tons/mi² |
来源: [鏈接] Moran, D., Kanemoto K; Jiborn, M., Wood, R., Többen, J., and Seto, K.C. (2018) Carbon footprints of 13,000 cities. Environmental Research Letters DOI: 10.1088/1748-9326/aac72a
Hemphill的CO2排放
| 2013年CO2排放量(吨/年) | 36,200 tn |
| 2013年人均CO2排放量(吨/年) | 28.35 tn |
| 2013年CO2排放强度(吨/mi²/年) | 14,019.7 tons/mi² |
自然災害風險
Relative risk out of 10
| 危险 | Risk Level |
|---|---|
| Flood | Medium (7) |
* Risk, particularly concerning flood or landslide, may not be for the entire area.
来源:
- Dilley, M., R.S. Chen, U. Deichmann, A.L. Lerner-Lam, M. Arnold, J. Agwe, P. Buys, O. Kjekstad, B. Lyon, and G. Yetman. 2005. Natural Disaster Hotspots: A Global Risk Analysis. Washington, D.C.: World Bank. https://doi.org/10.1596/0-8213-5930-4.
- Center for Hazards and Risk Research - CHRR - Columbia University, Center for International Earth Science Information Network - CIESIN - Columbia University. 2005. Global Flood Hazard Frequency and Distribution. Palisades, NY: NASA Socioeconomic Data and Applications Center (SEDAC). https://doi.org/10.7927/H4668B3D.
最近的附近地震
幅度3.0以上
| 日▼ | 時間↕ | Magnitude↕ | Distance↕ | 深度↕ | 位置↕ | 鏈接 |
|---|---|---|---|---|---|---|
| 1/20/19 | 11:32 AM | 3.3 | 31 km | 5,000 m | 7km SSW of San Augustine, Texas | usgs.gov |
| 9/4/18 | 3:06 PM | 3.5 | 88.5 km | 5,000 m | 7km NNW of Timpson, Texas | usgs.gov |
| 10/3/14 | 4:52 AM | 3.1 | 42.1 km | 5,000 m | 16km NNE of San Augustine, Texas | usgs.gov |
| 9/2/13 | 11:51 PM | 4.3 | 83.8 km | 4,690 m | 3km WNW of Timpson, Texas | usgs.gov |
| 9/2/13 | 9:52 PM | 4.2 | 94.6 km | 4,750 m | 14km WNW of Timpson, Texas | usgs.gov |
| 1/25/13 | 7:01 AM | 4.1 | 70.5 km | 5,000 m | 11km SE of Timpson, Texas | usgs.gov |
| 5/17/12 | 8:12 AM | 4.8 | 81.6 km | 5,000 m | eastern Texas | usgs.gov |
| 5/10/12 | 3:15 PM | 3.9 | 90.6 km | 7,000 m | eastern Texas | usgs.gov |

關於我們的數據
本页面上的数据是使用许多公开可用的工具和资源估算的。它不附带任何担保,可能包含不准确之处。使用风险自负。