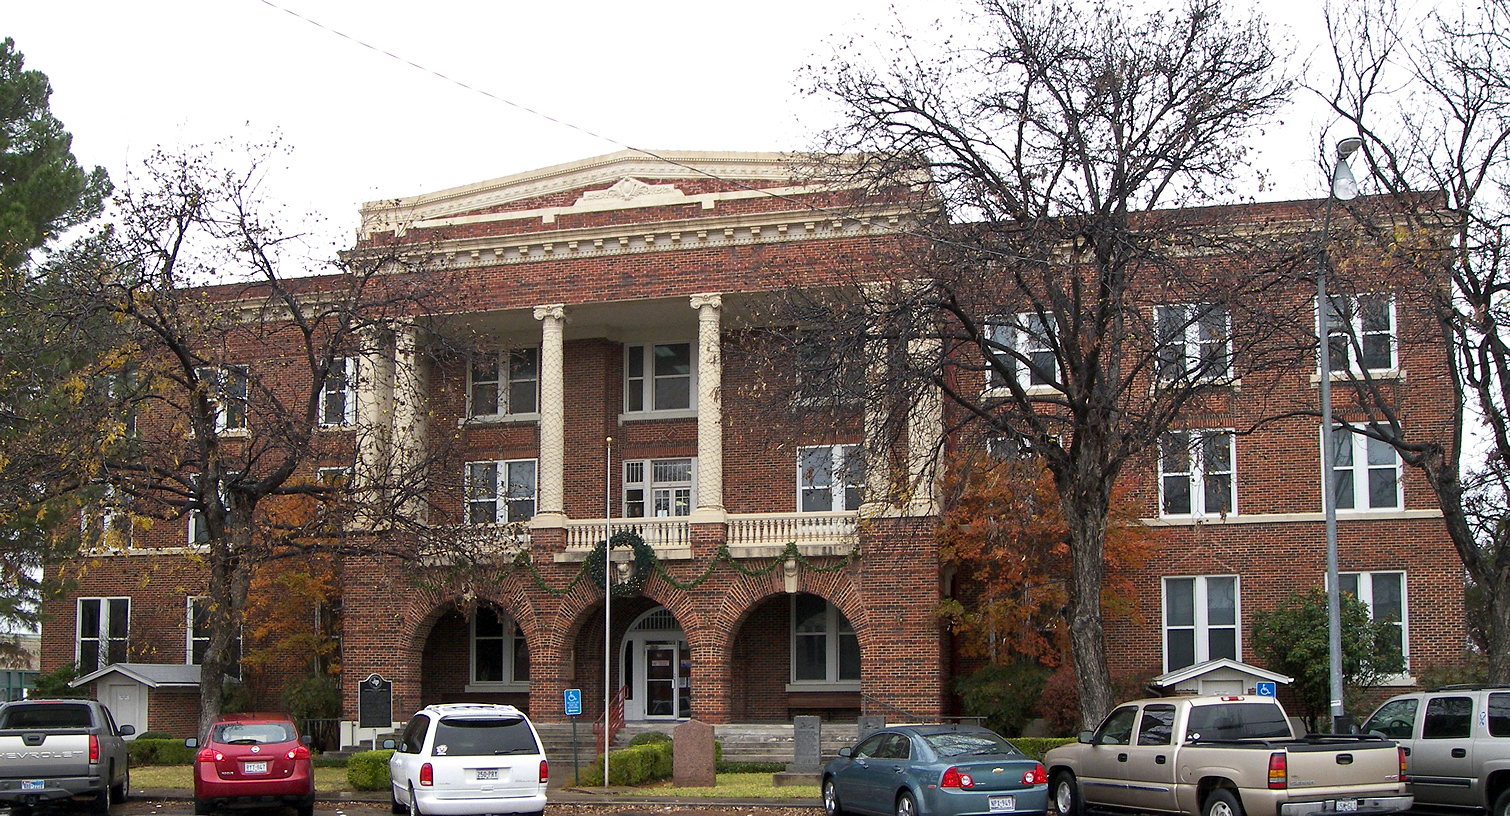
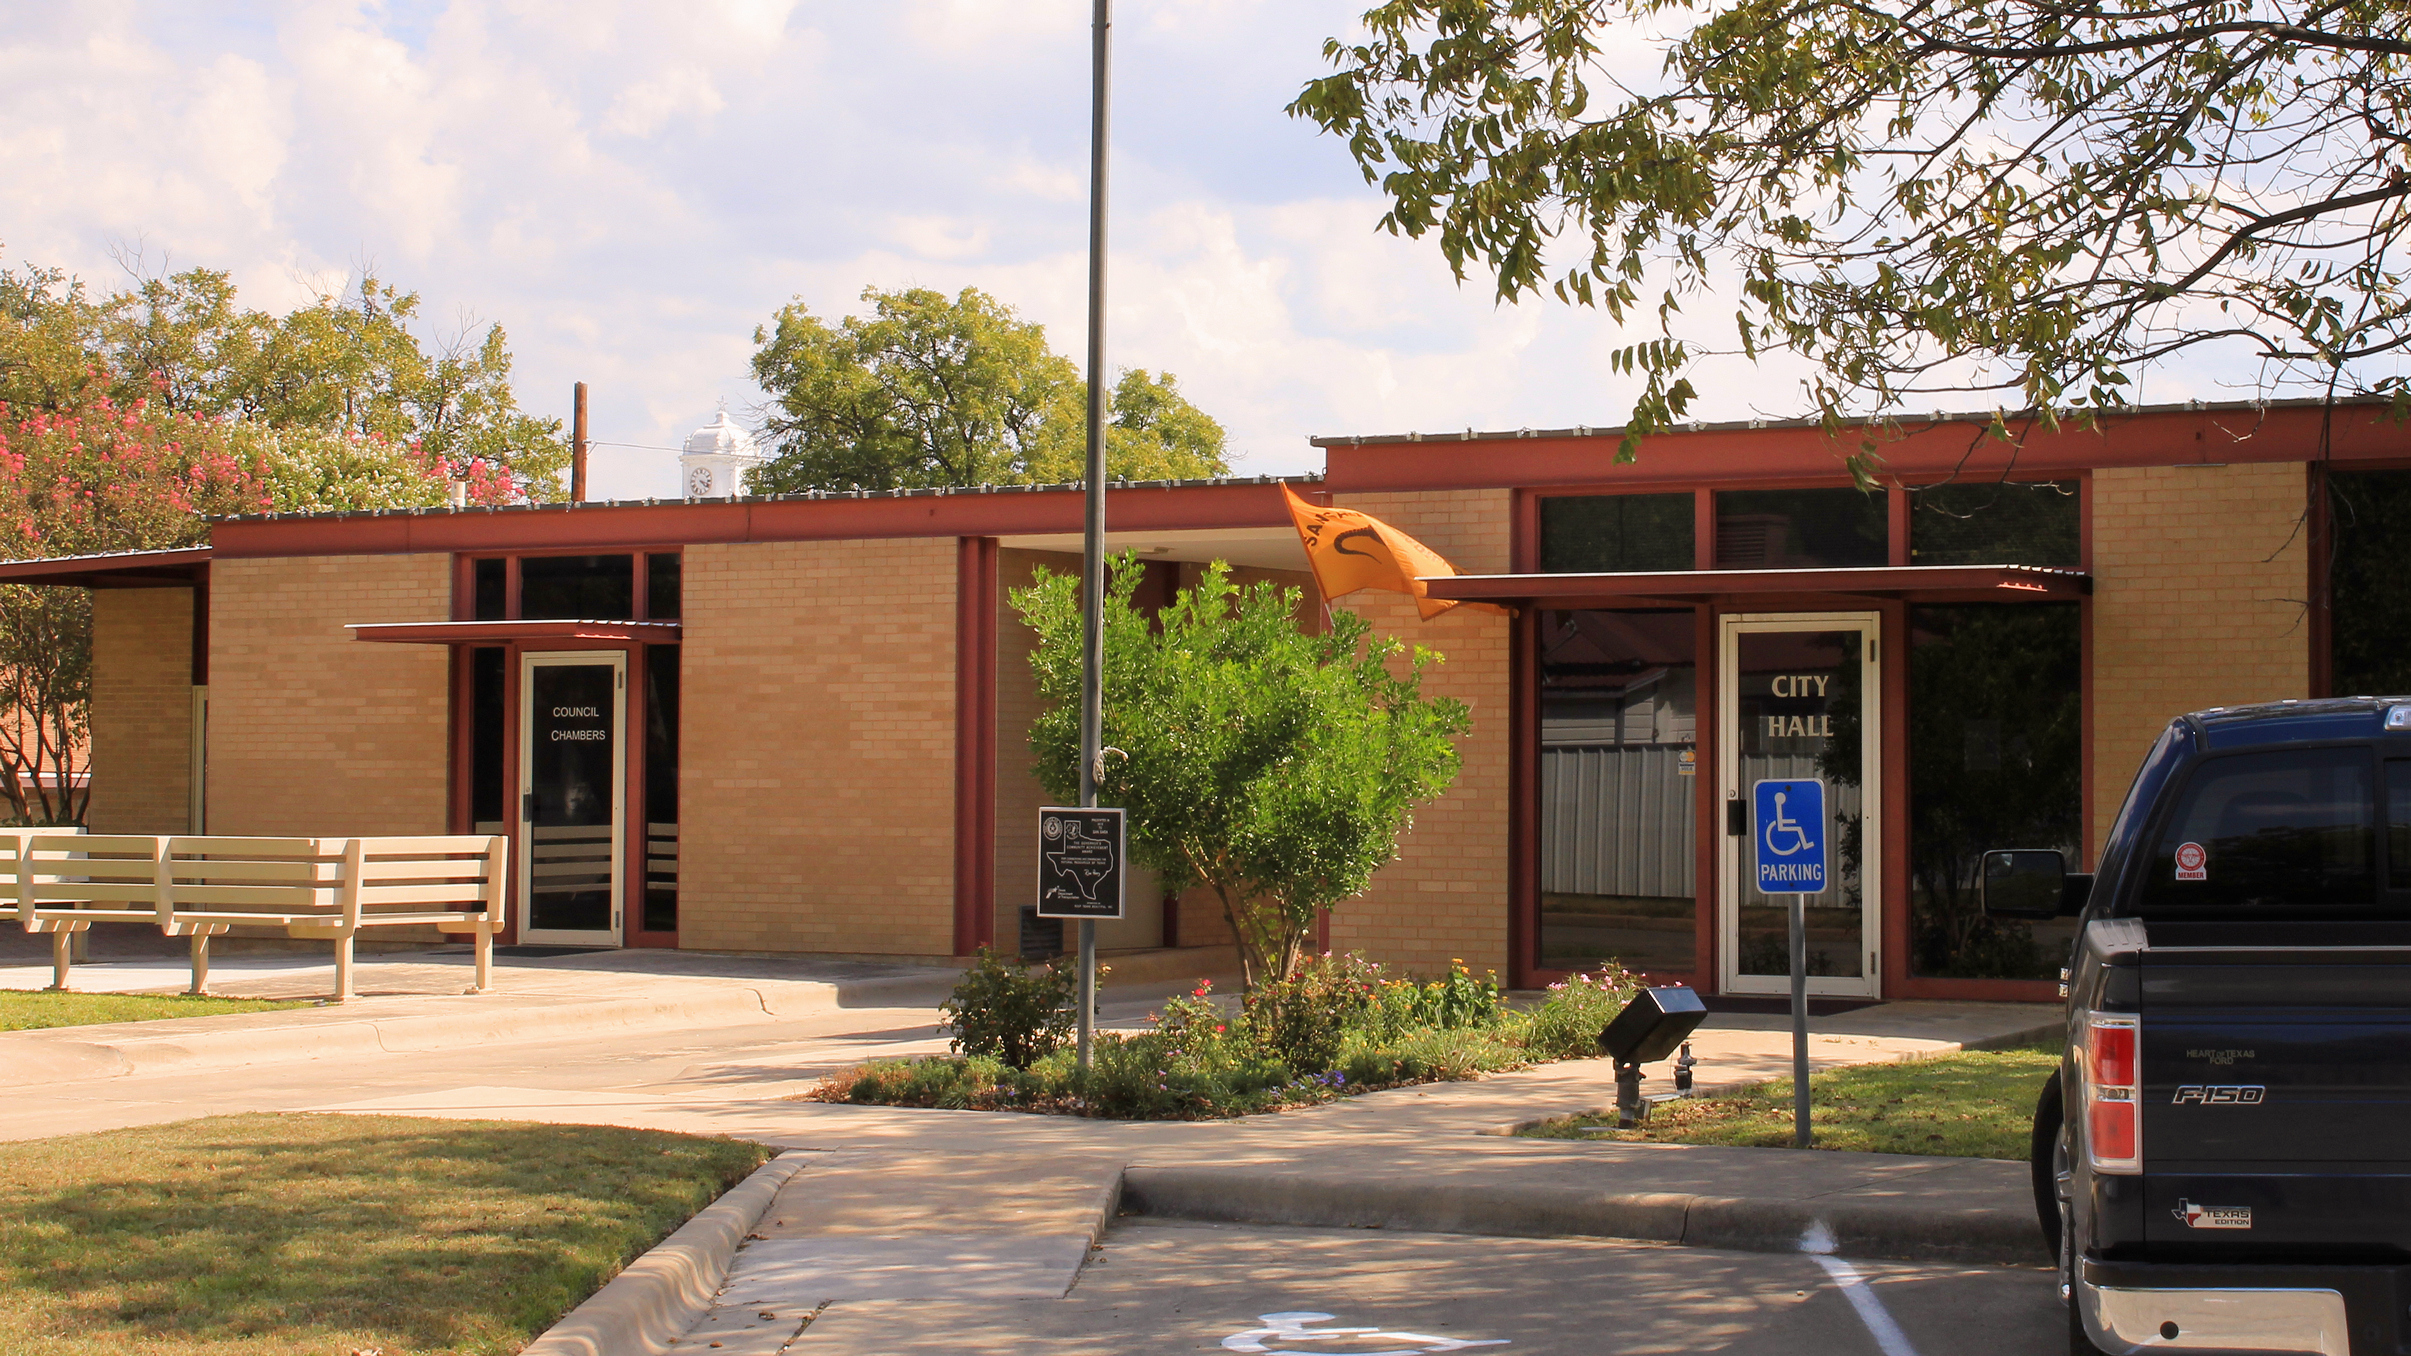
產業領域
Goldthwaite按行业的企业分布
| 行業說明 | 機構數 | 平均營業年齡 | Google平均評分 |
|---|---|---|---|
| 商场 | 31 | 42 years | 4.3 |
| 健康和医疗 | 23 | 25 years | 4.9 |
| 杂货店和超市 | 22 | 34 years | 4.5 |
| 农场和牧场 | 20 | 37 years | 4.6 |
| 公共管理 | 18 | 54 years | 4.6 |
| 房地产 | 15 | 54 years | — |
| 汽车维修 | 12 | 36 years | 4.7 |
| 宗教 | 11 | 58 years | 5 |
| 教堂 | 11 | 56 years | 5 |
| 餐馆 | 11 | 34 years | 4 |
| 汽车 | 10 | — | — |
| 所有食品和饮料 | 9 | 42 years | 4.5 |
| 五金店 | 8 | 41 years | 4.8 |
| 教育 | 7 | 50 years | 4.5 |
| 内科医生与外科医生 | 7 | — | 5 |
| 一般承包商 | 7 | 32 years | 5 |
| 银行 | 6 | — | 4.7 |
| 购物 - 其他 | 6 | 34 years | 4.6 |
| 拖拉机和农用设备 | 6 | 45 years | 4.8 |
| 企业管理 | 5 | — | — |
| 新车经销商 | 5 | — | — |
| 律师 | 5 | — | — |
| 建筑材料批发 | 5 | — | 5 |
Goldthwaite的地圖
互動地圖
Goldthwaite的人口
1975年至2020年
| Data | 1975 | 1990 | 2000 | 2015 | 2020 |
|---|---|---|---|---|---|
| 人口 | 733 | 1,422 | 1,915 | 1,772 | 1,792 |
| 人口密度 | 433.9 / mi² | 841.8 / mi² | 1,133.7 / mi² | 1,049 / mi² | 1,060.9 / mi² |
来源: JRC (European Commission's Joint Research Centre) 工作于 GHS built-up grid
Goldthwaite从2000年到2015年的人口变化
从2000年到2015年下降了7.5%
| 位置 | 自1975以来的变化 | 自1990以来的变化 | 自2000以来的变化 |
|---|---|---|---|
| Goldthwaite | +141.7% | +24.6% | -7.5% |
| 德克萨斯州 | +111% | +60.8% | +31.3% |
| 美国 | +46.9% | +27.2% | +13.7% |
来源: JRC (European Commission's Joint Research Centre) 工作于 GHS built-up grid
Goldthwaite的中位年龄
中位年龄:42.6岁
| 位置 | 年齡中位數 | 中位年齡(女) | 中位年齡(男) |
|---|---|---|---|
| Goldthwaite | 42.6 yrs | 45.6 yrs | 39.2 yrs |
| 德克萨斯州 | 33.8 yrs | 34.8 yrs | 32.8 yrs |
| 美国 | 37.4 yrs | 38.7 yrs | 36.1 yrs |
来源: CIESIN (Center for International Earth Science Information Network)
Goldthwaite的人口密度
人口密度:1,061 / mi²
| 位置 | 人口 | 區 | 密度 |
|---|---|---|---|
| Goldthwaite | 1,792 | 1.689 sq mi | 1,061 / mi² |
| 德克萨斯州 | 27.5 million | 268,596.2 sq mi | 103 / mi² |
| 美国 | 321.6 million | 3,796,740.8 sq mi | 84.7 / mi² |
来源: JRC (European Commission's Joint Research Centre) 工作于 GHS built-up grid
Goldthwaite的历史和预测人口
从1860到2100的估计人口
来源:
- JRC (European Commission's Joint Research Centre) 工作于 GHS built-up grid
- CIESIN (Center for International Earth Science Information Network)
- [鏈接] Klein Goldewijk, K., Beusen, A., Doelman, J., and Stehfest, E.: Anthropogenic land use estimates for the Holocene – HYDE 3.2, Earth Syst. Sci. Data, 9, 927–953, https://doi.org/10.5194/essd-9-927-2017, 2017.
价格分布
Goldthwaite企業(按價格分佈)
人類發展指數(HDI)
預期壽命,教育程度和人均收入的統計綜合指數。
来源: [鏈接] Kummu, M., Taka, M. &Guillaume, J. Gridded global datasets for Gross Domestic Product and Human Development Index over 1990–2015. Sci Data 5, 180004 (2018) doi:10.1038/sdata.2018.4
Goldthwaite的CO2排放
每年人均二氧化碳(CO2)排放量(噸)
| 位置 | 二氧化碳排放量 | 人均二氧化碳排放量 | 二氧化碳排放強度 |
|---|---|---|---|
| Goldthwaite | 35,638 tn | 19.89 tn | 21,097.8 tons/mi² |
| 德克萨斯州 | 488,896,034 tn | 17.76 tn | 1,820.2 tons/mi² |
| 美国 | 5,664,619,810 tn | 17.62 tn | 1,492 tons/mi² |
来源: [鏈接] Moran, D., Kanemoto K; Jiborn, M., Wood, R., Többen, J., and Seto, K.C. (2018) Carbon footprints of 13,000 cities. Environmental Research Letters DOI: 10.1088/1748-9326/aac72a
Goldthwaite的CO2排放
| 2013年CO2排放量(吨/年) | 35,638 tn |
| 2013年人均CO2排放量(吨/年) | 19.89 tn |
| 2013年CO2排放强度(吨/mi²/年) | 21,097.8 tons/mi² |
自然災害風險
Relative risk out of 10
| 危险 | Risk Level |
|---|---|
| Drought | Low (2) |
| Flood | Medium (4) |
* Risk, particularly concerning flood or landslide, may not be for the entire area.
来源:
- Dilley, M., R.S. Chen, U. Deichmann, A.L. Lerner-Lam, M. Arnold, J. Agwe, P. Buys, O. Kjekstad, B. Lyon, and G. Yetman. 2005. Natural Disaster Hotspots: A Global Risk Analysis. Washington, D.C.: World Bank. https://doi.org/10.1596/0-8213-5930-4.
- Center for Hazards and Risk Research - CHRR - Columbia University, Center for International Earth Science Information Network - CIESIN - Columbia University, and International Research Institute for Climate and Society - IRI - Columbia University. 2005. Global Drought Hazard Frequency and Distribution. Palisades, NY: NASA Socioeconomic Data and Applications Center (SEDAC). https://doi.org/10.7927/H4VX0DFT.
- Center for Hazards and Risk Research - CHRR - Columbia University, Center for International Earth Science Information Network - CIESIN - Columbia University. 2005. Global Flood Hazard Frequency and Distribution. Palisades, NY: NASA Socioeconomic Data and Applications Center (SEDAC). https://doi.org/10.7927/H4668B3D.

關於我們的數據
本页面上的数据是使用许多公开可用的工具和资源估算的。它不附带任何担保,可能包含不准确之处。使用风险自负。