Paniqui的类别
加油站摩托车经销商新车经销商汽车维修汽车部件洗车及保养建筑材料批发批发商拖拉机和农用设备食品、饲料和烟草的批发服装店手机店电台广播公共管理其他会员组织宗教教堂电子产品商店一般承包商五金店房屋建设楼宇的建筑中小学中等教育教育高等教育(学院和大学)咖啡快餐店所有食品和饮料杂货店和超市比萨汉堡店烘焙坊糖果店网吧酒馆和酒吧和小旅馆餐馆修理 - 其他园林绿化家具店家用电器和物品苗圃和园艺用具自动取款机贷款公司金融 - 其他银行健康和医疗全科医生内科门诊部医院墓地和火葬场牙科医生药房和药店健身中心美容院企业服务公寓书店和报摊便利店商场玩具和游戏零售百货商店购物 - 其他体育用品公园自行车公交和火车其他住宿其他运输业务度假别墅、小木屋和度假村快递和送货上门旅行和运输旅行社酒店旅馆
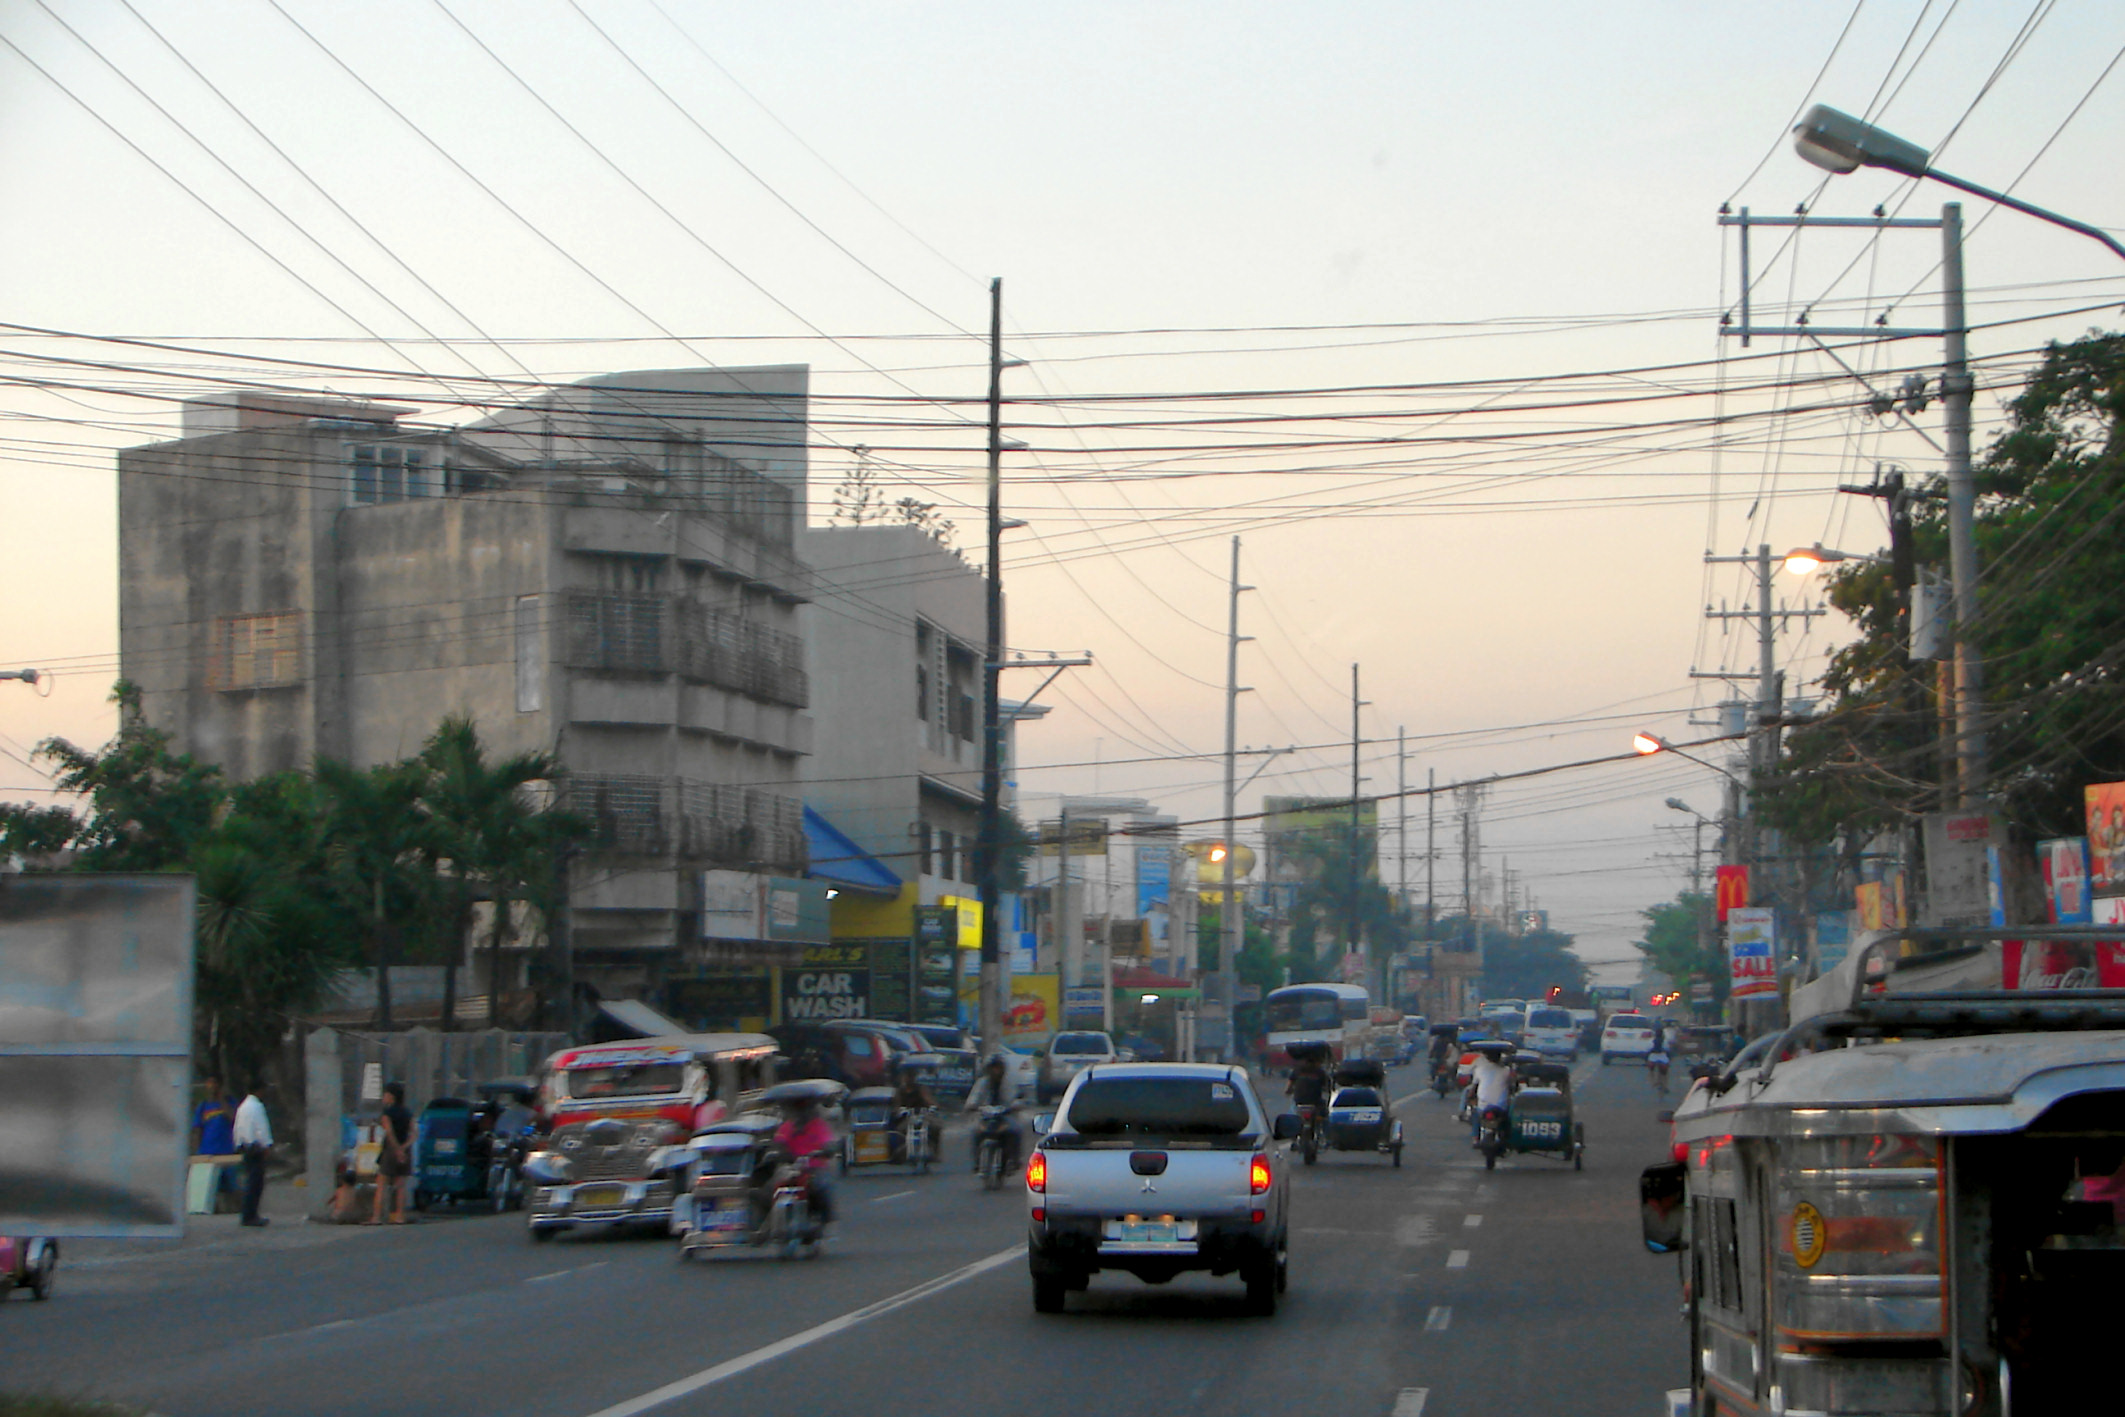
產業領域
Paniqui按行业的企业分布
Paniqui的地圖
互動地圖
Paniqui的人口
1975年至2020年
| Data | 1975 | 1990 | 2000 | 2015 | 2020 |
|---|---|---|---|---|---|
| 人口 | 16,888 | 44,343 | 61,308 | 81,495 | 88,918 |
| 人口密度 | 207.9 / km² | 545.8 / km² | 754.6 / km² | 1,003 / km² | 1,094.4 / km² |
来源: JRC (European Commission's Joint Research Centre) 工作于 GHS built-up grid
Paniqui从2000年到2015年的人口变化
从2000年到2015年增长了32.9%
| 位置 | 自1975以来的变化 | 自1990以来的变化 | 自2000以来的变化 |
|---|---|---|---|
| Paniqui | +382.6% | +83.8% | +32.9% |
| 菲律宾 | +146.5% | +63.3% | +29.5% |
来源: JRC (European Commission's Joint Research Centre) 工作于 GHS built-up grid
Paniqui的中位年龄
中位年龄:26.1岁
| 位置 | 年齡中位數 | 中位年齡(女) | 中位年齡(男) |
|---|---|---|---|
| Paniqui | 26.1 yrs | 27 yrs | 25.2 yrs |
| 菲律宾 | 23.2 yrs | 23.6 yrs | 22.8 yrs |
来源: CIESIN (Center for International Earth Science Information Network)
Paniqui的人口密度
人口密度:1,094 / km²
| 位置 | 人口 | 區 | 密度 |
|---|---|---|---|
| Paniqui | 88,918 | 81.3 km² | 1,094 / km² |
| 菲律宾 | 96.6 million | 296,939.4 km² | 325 / km² |
来源: JRC (European Commission's Joint Research Centre) 工作于 GHS built-up grid
Paniqui的历史和预测人口
从1870到2100的估计人口
来源:
- JRC (European Commission's Joint Research Centre) 工作于 GHS built-up grid
- CIESIN (Center for International Earth Science Information Network)
- [鏈接] Klein Goldewijk, K., Beusen, A., Doelman, J., and Stehfest, E.: Anthropogenic land use estimates for the Holocene – HYDE 3.2, Earth Syst. Sci. Data, 9, 927–953, https://doi.org/10.5194/essd-9-927-2017, 2017.
Paniqui的街区
Paniqui各街区企业占比
价格分布
Paniqui企業(按價格分佈)
人類發展指數(HDI)
預期壽命,教育程度和人均收入的統計綜合指數。
来源: [鏈接] Kummu, M., Taka, M. &Guillaume, J. Gridded global datasets for Gross Domestic Product and Human Development Index over 1990–2015. Sci Data 5, 180004 (2018) doi:10.1038/sdata.2018.4
Paniqui的CO2排放
每年人均二氧化碳(CO2)排放量(噸)
| 位置 | 二氧化碳排放量 | 人均二氧化碳排放量 | 二氧化碳排放強度 |
|---|---|---|---|
| Paniqui | 116,928 tn | 1.32 tn | 1,439.1 tons/km² |
| 菲律宾 | 104,920,564 tn | 1.09 tn | 353.3 tons/km² |
来源: [鏈接] Moran, D., Kanemoto K; Jiborn, M., Wood, R., Többen, J., and Seto, K.C. (2018) Carbon footprints of 13,000 cities. Environmental Research Letters DOI: 10.1088/1748-9326/aac72a
Paniqui的CO2排放
| 2013年CO2排放量(吨/年) | 116,928 tn |
| 2013年人均CO2排放量(吨/年) | 1.32 tn |
| 2013年CO2排放强度(吨/km²/年) | 1,439.1 tons/km² |
自然災害風險
Relative risk out of 10
| 危险 | Risk Level |
|---|---|
| Drought | Low (2) |
| Flood | High (10) |
| Earthquake | High (7.3) |
| Cyclone | High (10) |
* Risk, particularly concerning flood or landslide, may not be for the entire area.
来源:
- Dilley, M., R.S. Chen, U. Deichmann, A.L. Lerner-Lam, M. Arnold, J. Agwe, P. Buys, O. Kjekstad, B. Lyon, and G. Yetman. 2005. Natural Disaster Hotspots: A Global Risk Analysis. Washington, D.C.: World Bank. https://doi.org/10.1596/0-8213-5930-4.
- Center for Hazards and Risk Research - CHRR - Columbia University, Center for International Earth Science Information Network - CIESIN - Columbia University, International Bank for Reconstruction and Development - The World Bank, and United Nations Environment Programme Global Resource Information Database Geneva - UNEP/GRID-Geneva. 2005. Global Cyclone Hazard Frequency and Distribution. Palisades, NY: NASA Socioeconomic Data and Applications Center (SEDAC). https://doi.org/10.7927/H4CZ353K.
- Center for Hazards and Risk Research - CHRR - Columbia University, Center for International Earth Science Information Network - CIESIN - Columbia University, and International Research Institute for Climate and Society - IRI - Columbia University. 2005. Global Drought Hazard Frequency and Distribution. Palisades, NY: NASA Socioeconomic Data and Applications Center (SEDAC). https://doi.org/10.7927/H4VX0DFT.
- Center for Hazards and Risk Research - CHRR - Columbia University, Center for International Earth Science Information Network - CIESIN - Columbia University. 2005. Global Flood Hazard Frequency and Distribution. Palisades, NY: NASA Socioeconomic Data and Applications Center (SEDAC). https://doi.org/10.7927/H4668B3D.
- Center for Hazards and Risk Research - CHRR - Columbia University, Center for International Earth Science Information Network - CIESIN - Columbia University. 2005. Global Earthquake Hazard Distribution - Peak Ground Acceleration. Palisades, NY: NASA Socioeconomic Data and Applications Center (SEDAC). https://doi.org/10.7927/H4BZ63ZS.
最近的附近地震
幅度3.0以上
| 日▼ | 時間↕ | Magnitude↕ | Distance↕ | 深度↕ | 位置↕ | 鏈接 |
|---|---|---|---|---|---|---|
| 2/7/19 | 10:28 PM | 4.3 | 22.1 km | 156,490 m | 1km SSW of Maturanoc, Philippines | usgs.gov |
| 2/6/19 | 10:25 AM | 5.5 | 21.3 km | 130,199 m | 1km NNE of Guiling, Philippines | usgs.gov |
| 12/28/18 | 11:47 AM | 4.6 | 39.9 km | 165,920 m | 1km ESE of Concepcion, Philippines | usgs.gov |
| 10/9/18 | 3:29 PM | 4.5 | 49.5 km | 103,440 m | 0km W of Quintong, Philippines | usgs.gov |
| 7/27/14 | 11:27 AM | 4.2 | 43.2 km | 53,040 m | 3km N of Taboy Norte, Philippines | usgs.gov |
| 6/29/14 | 10:25 PM | 4.1 | 51.3 km | 10,000 m | 13km WSW of Santa Juliana, Philippines | usgs.gov |
| 12/18/13 | 2:46 PM | 4.9 | 51.1 km | 51,430 m | 9km ENE of Alac, Philippines | usgs.gov |
| 11/19/12 | 7:54 AM | 4.1 | 44.8 km | 158,800 m | Luzon, Philippines | usgs.gov |
| 3/31/11 | 10:01 PM | 4.3 | 31.2 km | 28,700 m | Luzon, Philippines | usgs.gov |
| 10/7/10 | 10:39 PM | 4.7 | 29.3 km | 39,700 m | Luzon, Philippines | usgs.gov |


關於我們的數據
本页面上的数据是使用许多公开可用的工具和资源估算的。它不附带任何担保,可能包含不准确之处。使用风险自负。