Bolsward的类别
加油站新车经销商汽车修理和保养汽车维修商用打印机家具公司批发商木地板和复合地板供应商金属加工金属加工公司女装服装店男装童装和婴儿服装鞋店养老院协会或组织教堂日托中心货运代理公司货运和邮递服务辅助生活设施邮局邮递公司顾问IT 咨询数码城软件公司一般承包商基金会家居用品商店工程服务工程顾问建筑师承包商木匠机械工程师楼宇的建筑油漆与油漆承包商结构工程师小学小学幼儿园教育教育 - 其他教育机构瑜伽馆驾驶学校图文设计师摄影师网站设计师美术馆艺术家咖啡小酒馆屠夫快餐店杂货店和超市酒馆和酒吧和小旅馆餐馆饮食服务人员园丁家具店杂工租船服务保险公司房屋贷款公司控股公司會計簿记服务自动取款机财务顾问通用会计与簿记银行全科医生兽医家庭保健服务心理医生心理醫生护理服务机构整骨医生牙科医生物理治疗眼镜商和眼镜营养学家人生导师按摩理发师美发沙龙美容院美甲和修脚足部护理互联网营销服务保安服务出版广告公司清洁服务管理咨询公司营销机构房地产中介房地产开发商物业管理公司商场电子商务服务百货商店礼品店花店药店购物 - 其他超市酒类商店雕塑体育俱乐部健身房游乐场自行车床和早餐快递服务旅行社物流运输电动汽车充电站货运公司酒店旅馆
產業領域
Bolsward按行业的企业分布
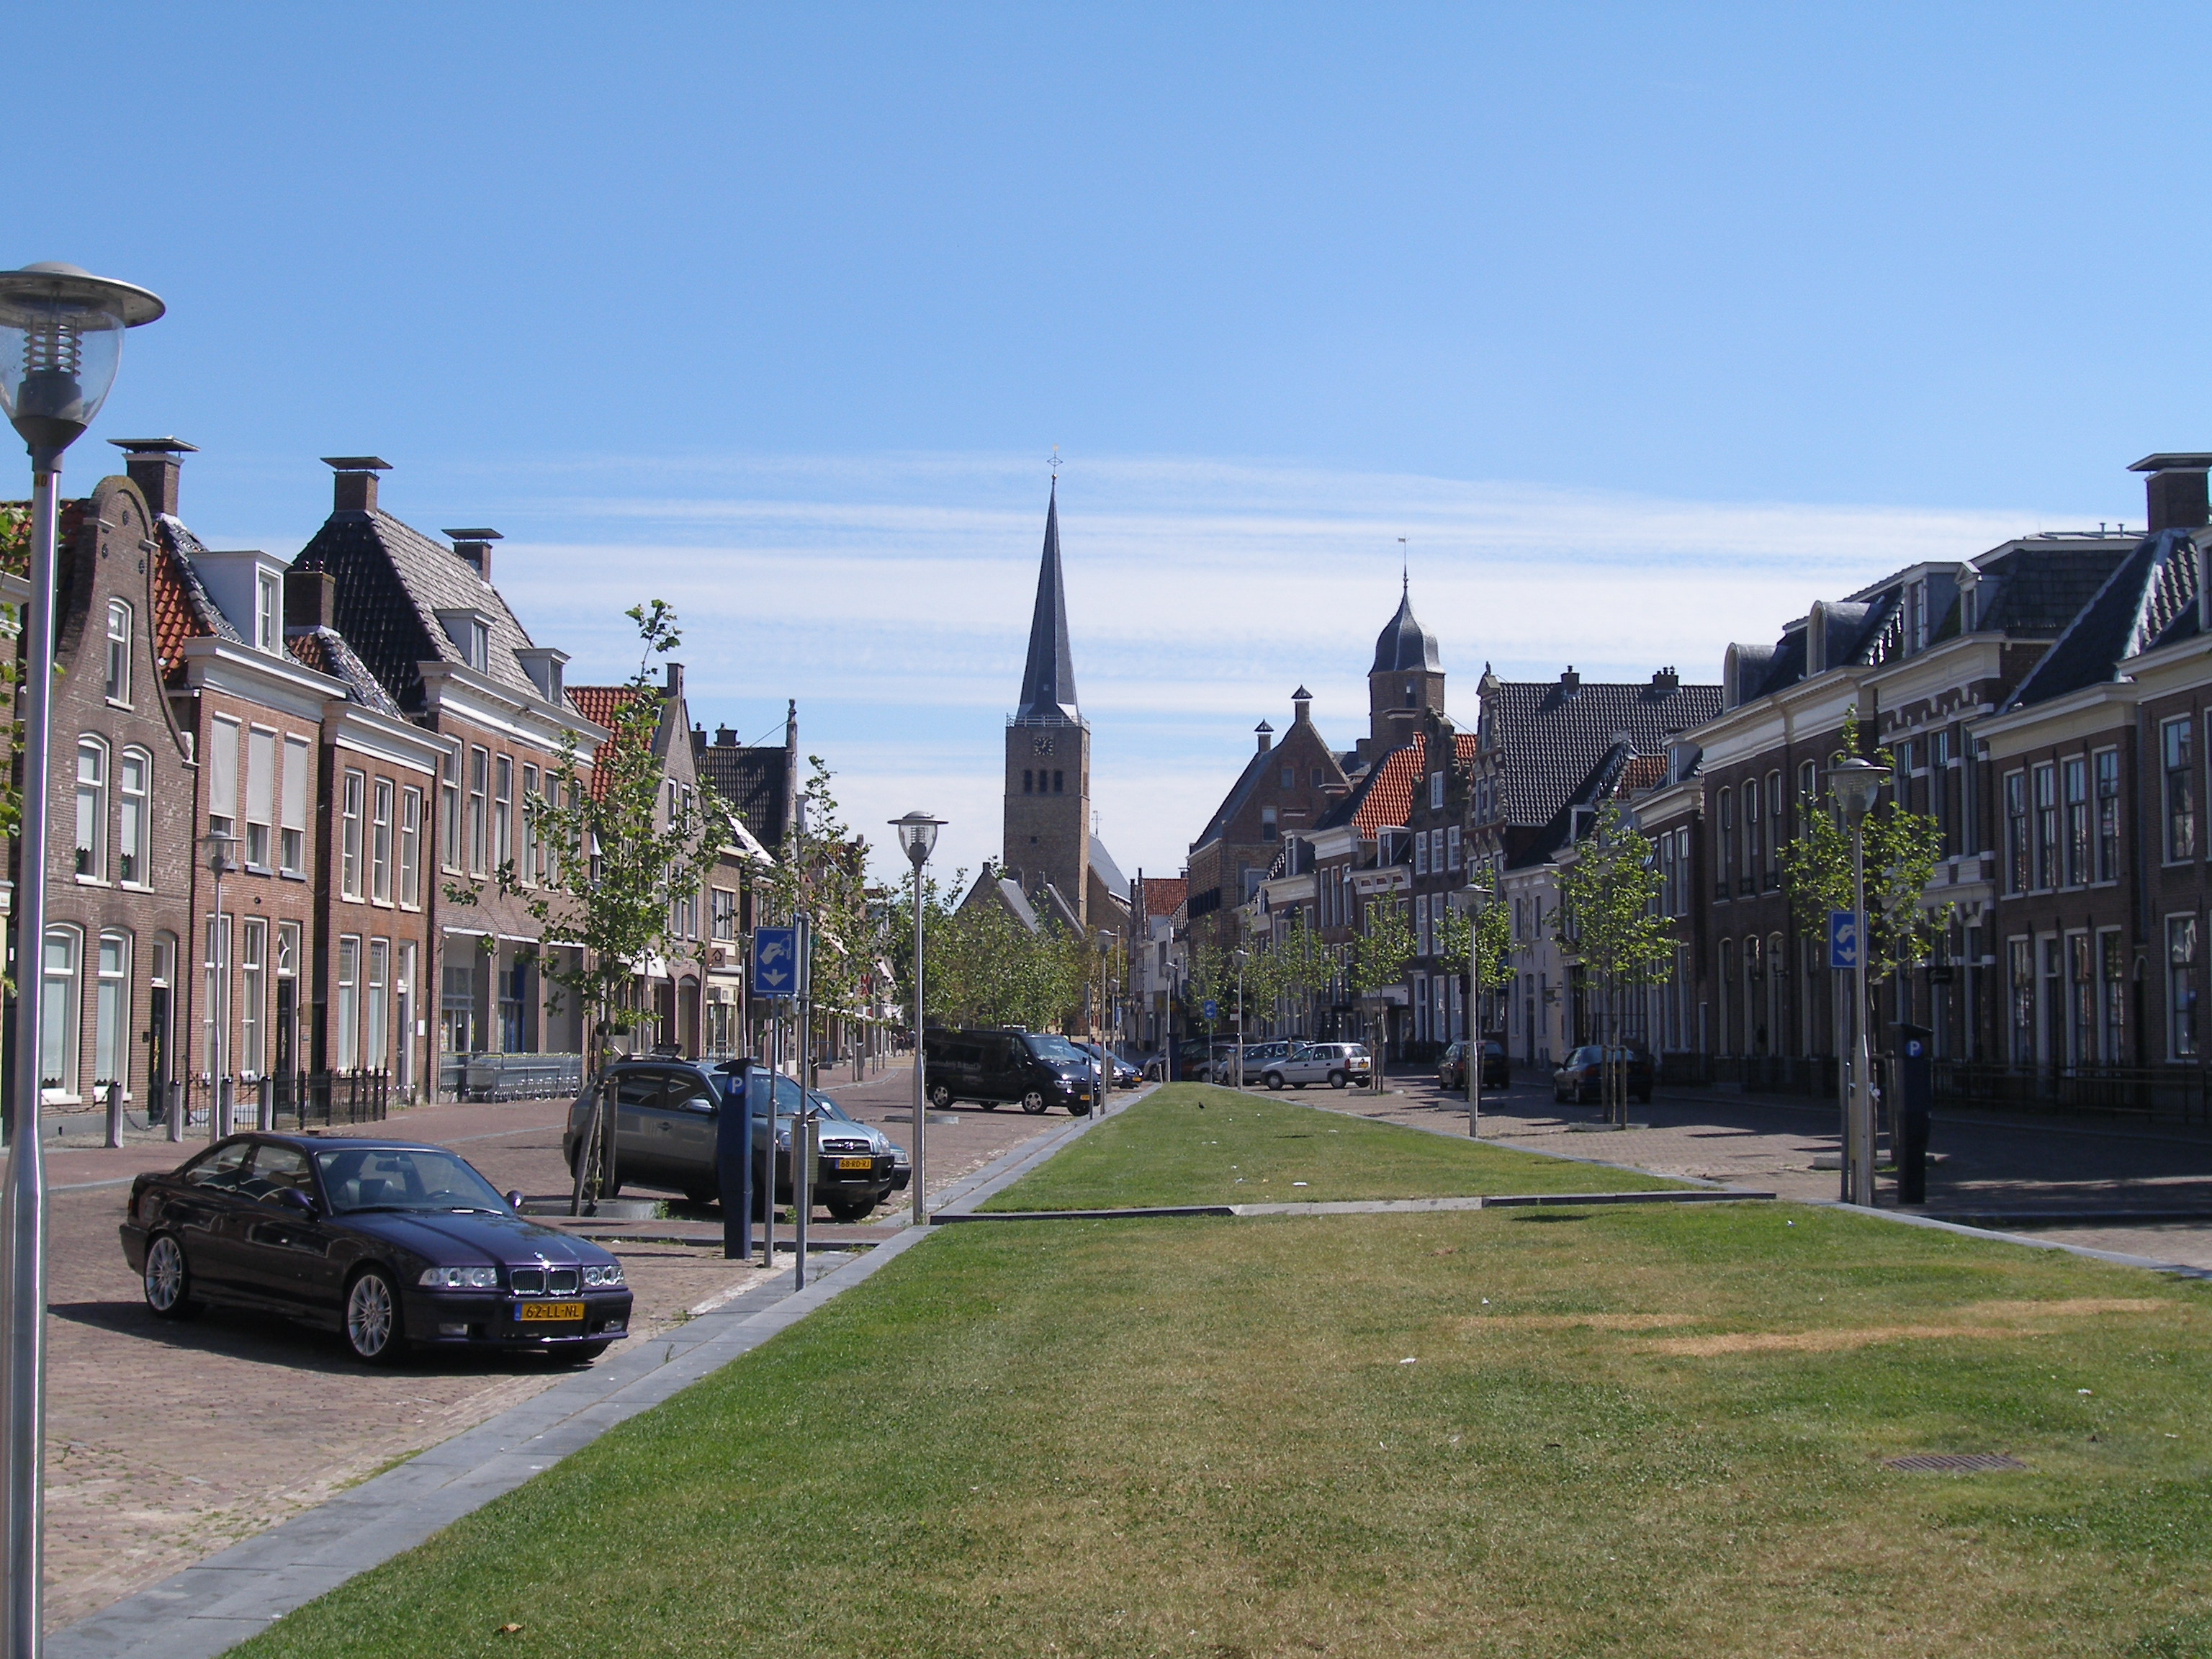
Bolsward的地圖
互動地圖
Bolsward的人口
1975年至2020年
| Data | 1975 | 1990 | 2000 | 2015 | 2020 |
|---|---|---|---|---|---|
| 人口 | 7,500 | 7,671 | 8,074 | 8,279 | 8,249 |
| 人口密度 | 784.3 / km² | 802.2 / km² | 844.3 / km² | 865.8 / km² | 862.6 / km² |
来源: JRC (European Commission's Joint Research Centre) 工作于 GHS built-up grid
Bolsward从2000年到2015年的人口变化
从2000年到2015年增长了2.5%
| 位置 | 自1975以来的变化 | 自1990以来的变化 | 自2000以来的变化 |
|---|---|---|---|
| Bolsward | +10.4% | +7.9% | +2.5% |
| 弗里斯兰省 | +18.8% | +9.6% | +4.1% |
| 荷兰 | +24.3% | +13.4% | +6.5% |
来源: JRC (European Commission's Joint Research Centre) 工作于 GHS built-up grid
Bolsward的中位年龄
中位年龄:42.4岁
| 位置 | 年齡中位數 | 中位年齡(女) | 中位年齡(男) |
|---|---|---|---|
| Bolsward | 42.4 yrs | 43.1 yrs | 41.6 yrs |
| 弗里斯兰省 | 41.9 yrs | 42.9 yrs | 41 yrs |
| 荷兰 | 41 yrs | 41.7 yrs | 40.2 yrs |
来源: CIESIN (Center for International Earth Science Information Network)
Bolsward的人口密度
人口密度:863 / km²
| 位置 | 人口 | 區 | 密度 |
|---|---|---|---|
| Bolsward | 8,249 | 9.6 km² | 863 / km² |
| 弗里斯兰省 | 653,256 | 5,751.4 km² | 114 / km² |
| 荷兰 | 16.9 million | 41,398.3 km² | 409 / km² |
来源: JRC (European Commission's Joint Research Centre) 工作于 GHS built-up grid
Bolsward的历史和预测人口
从0到2100的估计人口
来源:
- JRC (European Commission's Joint Research Centre) 工作于 GHS built-up grid
- CIESIN (Center for International Earth Science Information Network)
- [鏈接] Klein Goldewijk, K., Beusen, A., Doelman, J., and Stehfest, E.: Anthropogenic land use estimates for the Holocene – HYDE 3.2, Earth Syst. Sci. Data, 9, 927–953, https://doi.org/10.5194/essd-9-927-2017, 2017.
电话区号
Bolsward的企業使用的區碼百分比
邮政编码
Bolsward各邮政编码企业占比
价格分布
Bolsward企業(按價格分佈)
人類發展指數(HDI)
預期壽命,教育程度和人均收入的統計綜合指數。
来源: [鏈接] Kummu, M., Taka, M. &Guillaume, J. Gridded global datasets for Gross Domestic Product and Human Development Index over 1990–2015. Sci Data 5, 180004 (2018) doi:10.1038/sdata.2018.4
Bolsward的CO2排放
每年人均二氧化碳(CO2)排放量(噸)
| 位置 | 二氧化碳排放量 | 人均二氧化碳排放量 | 二氧化碳排放強度 |
|---|---|---|---|
| Bolsward | 92,824 tn | 11.25 tn | 9,707.1 tons/km² |
| 弗里斯兰省 | 4,518,084 tn | 6.92 tn | 785.6 tons/km² |
| 荷兰 | 167,743,568 tn | 9.91 tn | 4,051.9 tons/km² |
来源: [鏈接] Moran, D., Kanemoto K; Jiborn, M., Wood, R., Többen, J., and Seto, K.C. (2018) Carbon footprints of 13,000 cities. Environmental Research Letters DOI: 10.1088/1748-9326/aac72a
Bolsward的CO2排放
| 2013年CO2排放量(吨/年) | 92,824 tn |
| 2013年人均CO2排放量(吨/年) | 11.25 tn |
| 2013年CO2排放强度(吨/km²/年) | 9,707.1 tons/km² |
最近的附近地震
幅度3.0以上
| 日▼ | 時間↕ | Magnitude↕ | Distance↕ | 深度↕ | 位置↕ | 鏈接 |
|---|---|---|---|---|---|---|
| 5/22/19 | 3:48 AM | 3.2 | 79.3 km | 10,000 m | 8km NNE of Winsum, Netherlands | usgs.gov |
| 2/7/13 | 11:19 PM | 3.4 | 82.3 km | 10,000 m | 11km NNE of Winsum, Netherlands | usgs.gov |
| 8/16/12 | 8:30 PM | 3.4 | 87.1 km | 3,000 m | The Netherlands | usgs.gov |
| 10/30/08 | 5:54 AM | 3.3 | 79.5 km | 3,000 m | The Netherlands | usgs.gov |
| 8/8/06 | 5:03 AM | 3.8 | 74.8 km | 10,000 m | The Netherlands | usgs.gov |
| 6/21/04 | 11:32 PM | 3 | 63.6 km | 5,000 m | The Netherlands | usgs.gov |
| 11/10/03 | 12:22 AM | 3.1 | 63 km | 10,000 m | The Netherlands | usgs.gov |
| 9/10/01 | 4:30 AM | 3.4 | 98.1 km | 10,000 m | The Netherlands | usgs.gov |
| 9/9/01 | 6:58 AM | 3.8 | 84.9 km | 10,000 m | The Netherlands | usgs.gov |
| 2/19/97 | 9:53 PM | 3 | 81.2 km | 5,000 m | The Netherlands | usgs.gov |


關於我們的數據
本页面上的数据是使用许多公开可用的工具和资源估算的。它不附带任何担保,可能包含不准确之处。使用风险自负。