林梦的类别
加油站摩托车维修汽车修理和保养汽车维修汽车配件城洗车批发商女装服装店手机店电信服务商宗教宗教圣地宗教组织政府机构教堂村公所清真寺社区中心穆萨拉邮局非营利组织数码城五金店家居用品商店建材商店建筑施工承包商房地产开发承包商楼宇的建筑小学幼儿园教育旅游胜地中国餐馆亚洲风味餐馆健康美容店冰淇淋店咖啡咖啡館快餐店所有食品和饮料杂货店和超市汉堡店烘焙坊美食广场酒馆和酒吧和小旅馆餐馆家具店苗圃和园艺用具自动取款机银行公共医疗中心公墓眼镜商和眼镜综合医院理发店美发沙龙美容院企业对企业服务后勤部门公寓建筑私人屋苑便利店化妆品店商场市场电脑商店百货商场百货商店综合商店花店藥店购物中心购物 - 其他超市体育俱乐部公园彩票零售店游乐场仓库住宿住房协会别墅快递服务旅行社运输服务酒店旅馆无法访问
產業領域
林梦按行业的企业分布
| 行業說明 | 機構數 | Google平均評分 |
|---|---|---|
| 商场 | 98 | 3.6 |
| 餐馆 | 78 | 3.6 |
| 公共管理 | 51 | 3.8 |
| 楼宇的建筑 | 42 | 4.7 |
| 咖啡 | 39 | 3.7 |
| 教育 | 31 | 4.3 |
| 体育和休闲 | 30 | 4.7 |
| 汽车维修 | 27 | 3.1 |
| 教堂 | 22 | 4.5 |
| 办公用品和文具店 | 22 | 3 |
| 清真寺 | 19 | 4.2 |
| 美容院 | 18 | 5 |
| 中国餐馆 | 18 | 4 |
| 汽车部件 | 18 | 3.6 |
| 贷款公司 | 17 | 3.6 |
| 医院 | 17 | 2.8 |
| 银行 | 16 | 3.6 |
| 宗教 | 16 | 4.4 |
| 机场 | 16 | 3.5 |
| 快餐店 | 15 | 3.2 |
| 汽车 | 15 | 5 |
| 理发师 | 14 | — |
| 房屋建设 | 13 | — |
| 五金店 | 13 | — |
| 所有食品和饮料 | 13 | 3.7 |
顯示1-25,共32
林梦事实
| 區 | 74.9 km² |
| 人口 | 41,224 |
| 男性人口 | 21,112 (51.2%) |
| 女性人口 | 20,112 (48.8%) |
| 人口变化(1975 to 2020) | +112.9% |
| 人口变化(2000 to 2020) | +22.4% |
| 年齡中位數 | 24.1岁 (男:24.7,女:23.5) |
| 电话区号 | 85, 8521 |
| 鄰近社區 | Pekan Limbang, Limbang, Sarawak, Kubong Industrial Estate, Junction Of Jalan Buangsiol Off Jalan Bangkita |
| 當地時間 | |
| 時區 | 马来西亚时间 |
| 經度與緯度 | 4.75000, 115.00000 |
| 邮政编码 | 98700, 98707 |
林梦的地圖
互動地圖
林梦的人口
1975年至2020年
| Data | 1975 | 1990 | 2000 | 2015 | 2020 |
|---|---|---|---|---|---|
| 人口 | 19,359 | 27,666 | 33,692 | 38,221 | 41,224 |
| 人口密度 | 258.3 / km² | 369.2 / km² | 449.6 / km² | 510 / km² | 550.1 / km² |
来源: JRC (European Commission's Joint Research Centre) 工作于 GHS built-up grid
林梦从2000年到2015年的人口变化
从2000年到2015年增长了13.4%
| 位置 | 自1975以来的变化 | 自1990以来的变化 | 自2000以来的变化 |
|---|---|---|---|
| 林梦 | +97.4% | +38.2% | +13.4% |
| 砂拉越 | -85.9% | -72.6% | -56.2% |
| 马来西亚 | +145.8% | +66.5% | +29.4% |
来源: JRC (European Commission's Joint Research Centre) 工作于 GHS built-up grid
林梦的中位年龄
中位年龄:24.1岁
| 位置 | 年齡中位數 | 中位年齡(女) | 中位年齡(男) |
|---|---|---|---|
| 林梦 | 24.1 yrs | 23.5 yrs | 24.7 yrs |
| 砂拉越 | 24.9 yrs | 24.4 yrs | 25.5 yrs |
| 马来西亚 | 25.7 yrs | 25.7 yrs | 25.8 yrs |
来源: CIESIN (Center for International Earth Science Information Network)
林梦的人口密度
人口密度:550 / km²
| 位置 | 人口 | 區 | 密度 |
|---|---|---|---|
| 林梦 | 41,224 | 74.9 km² | 550 / km² |
| 砂拉越 | 32 | 22.3 km² | 1.4 / km² |
| 马来西亚 | 29.6 million | 329,840.2 km² | 89.7 / km² |
来源: JRC (European Commission's Joint Research Centre) 工作于 GHS built-up grid
林梦的历史和预测人口
从1780到2100的估计人口
来源:
- JRC (European Commission's Joint Research Centre) 工作于 GHS built-up grid
- CIESIN (Center for International Earth Science Information Network)
- [鏈接] Klein Goldewijk, K., Beusen, A., Doelman, J., and Stehfest, E.: Anthropogenic land use estimates for the Holocene – HYDE 3.2, Earth Syst. Sci. Data, 9, 927–953, https://doi.org/10.5194/essd-9-927-2017, 2017.
价格分布
林梦企業(按價格分佈)
人類發展指數(HDI)
預期壽命,教育程度和人均收入的統計綜合指數。
来源: [鏈接] Kummu, M., Taka, M. &Guillaume, J. Gridded global datasets for Gross Domestic Product and Human Development Index over 1990–2015. Sci Data 5, 180004 (2018) doi:10.1038/sdata.2018.4
林梦的CO2排放
每年人均二氧化碳(CO2)排放量(噸)
| 位置 | 二氧化碳排放量 | 人均二氧化碳排放量 | 二氧化碳排放強度 |
|---|---|---|---|
| 林梦 | 314,602 tn | 7.63 tn | 4,198.2 tons/km² |
| 砂拉越 | 125 tn | 3.91 tn | 5.6 tons/km² |
| 马来西亚 | 198,593,412 tn | 6.71 tn | 602.1 tons/km² |
来源: [鏈接] Moran, D., Kanemoto K; Jiborn, M., Wood, R., Többen, J., and Seto, K.C. (2018) Carbon footprints of 13,000 cities. Environmental Research Letters DOI: 10.1088/1748-9326/aac72a
林梦的CO2排放
| 2013年CO2排放量(吨/年) | 314,602 tn |
| 2013年人均CO2排放量(吨/年) | 7.63 tn |
| 2013年CO2排放强度(吨/km²/年) | 4,198.2 tons/km² |
自然災害風險
Relative risk out of 10
| 危险 | Risk Level |
|---|---|
| Earthquake | Low (2) |
| Landslide | Medium (6) |
* Risk, particularly concerning flood or landslide, may not be for the entire area.
来源:
- Dilley, M., R.S. Chen, U. Deichmann, A.L. Lerner-Lam, M. Arnold, J. Agwe, P. Buys, O. Kjekstad, B. Lyon, and G. Yetman. 2005. Natural Disaster Hotspots: A Global Risk Analysis. Washington, D.C.: World Bank. https://doi.org/10.1596/0-8213-5930-4.
- Center for Hazards and Risk Research - CHRR - Columbia University, Center for International Earth Science Information Network - CIESIN - Columbia University, and Norwegian Geotechnical Institute - NGI. 2005. Global Landslide Hazard Distribution. Palisades, NY: NASA Socioeconomic Data and Applications Center (SEDAC). https://doi.org/10.7927/H4P848VZ.
- Center for Hazards and Risk Research - CHRR - Columbia University, Center for International Earth Science Information Network - CIESIN - Columbia University. 2005. Global Earthquake Hazard Distribution - Peak Ground Acceleration. Palisades, NY: NASA Socioeconomic Data and Applications Center (SEDAC). https://doi.org/10.7927/H4BZ63ZS.
最近的附近地震
幅度3.0以上
林梦
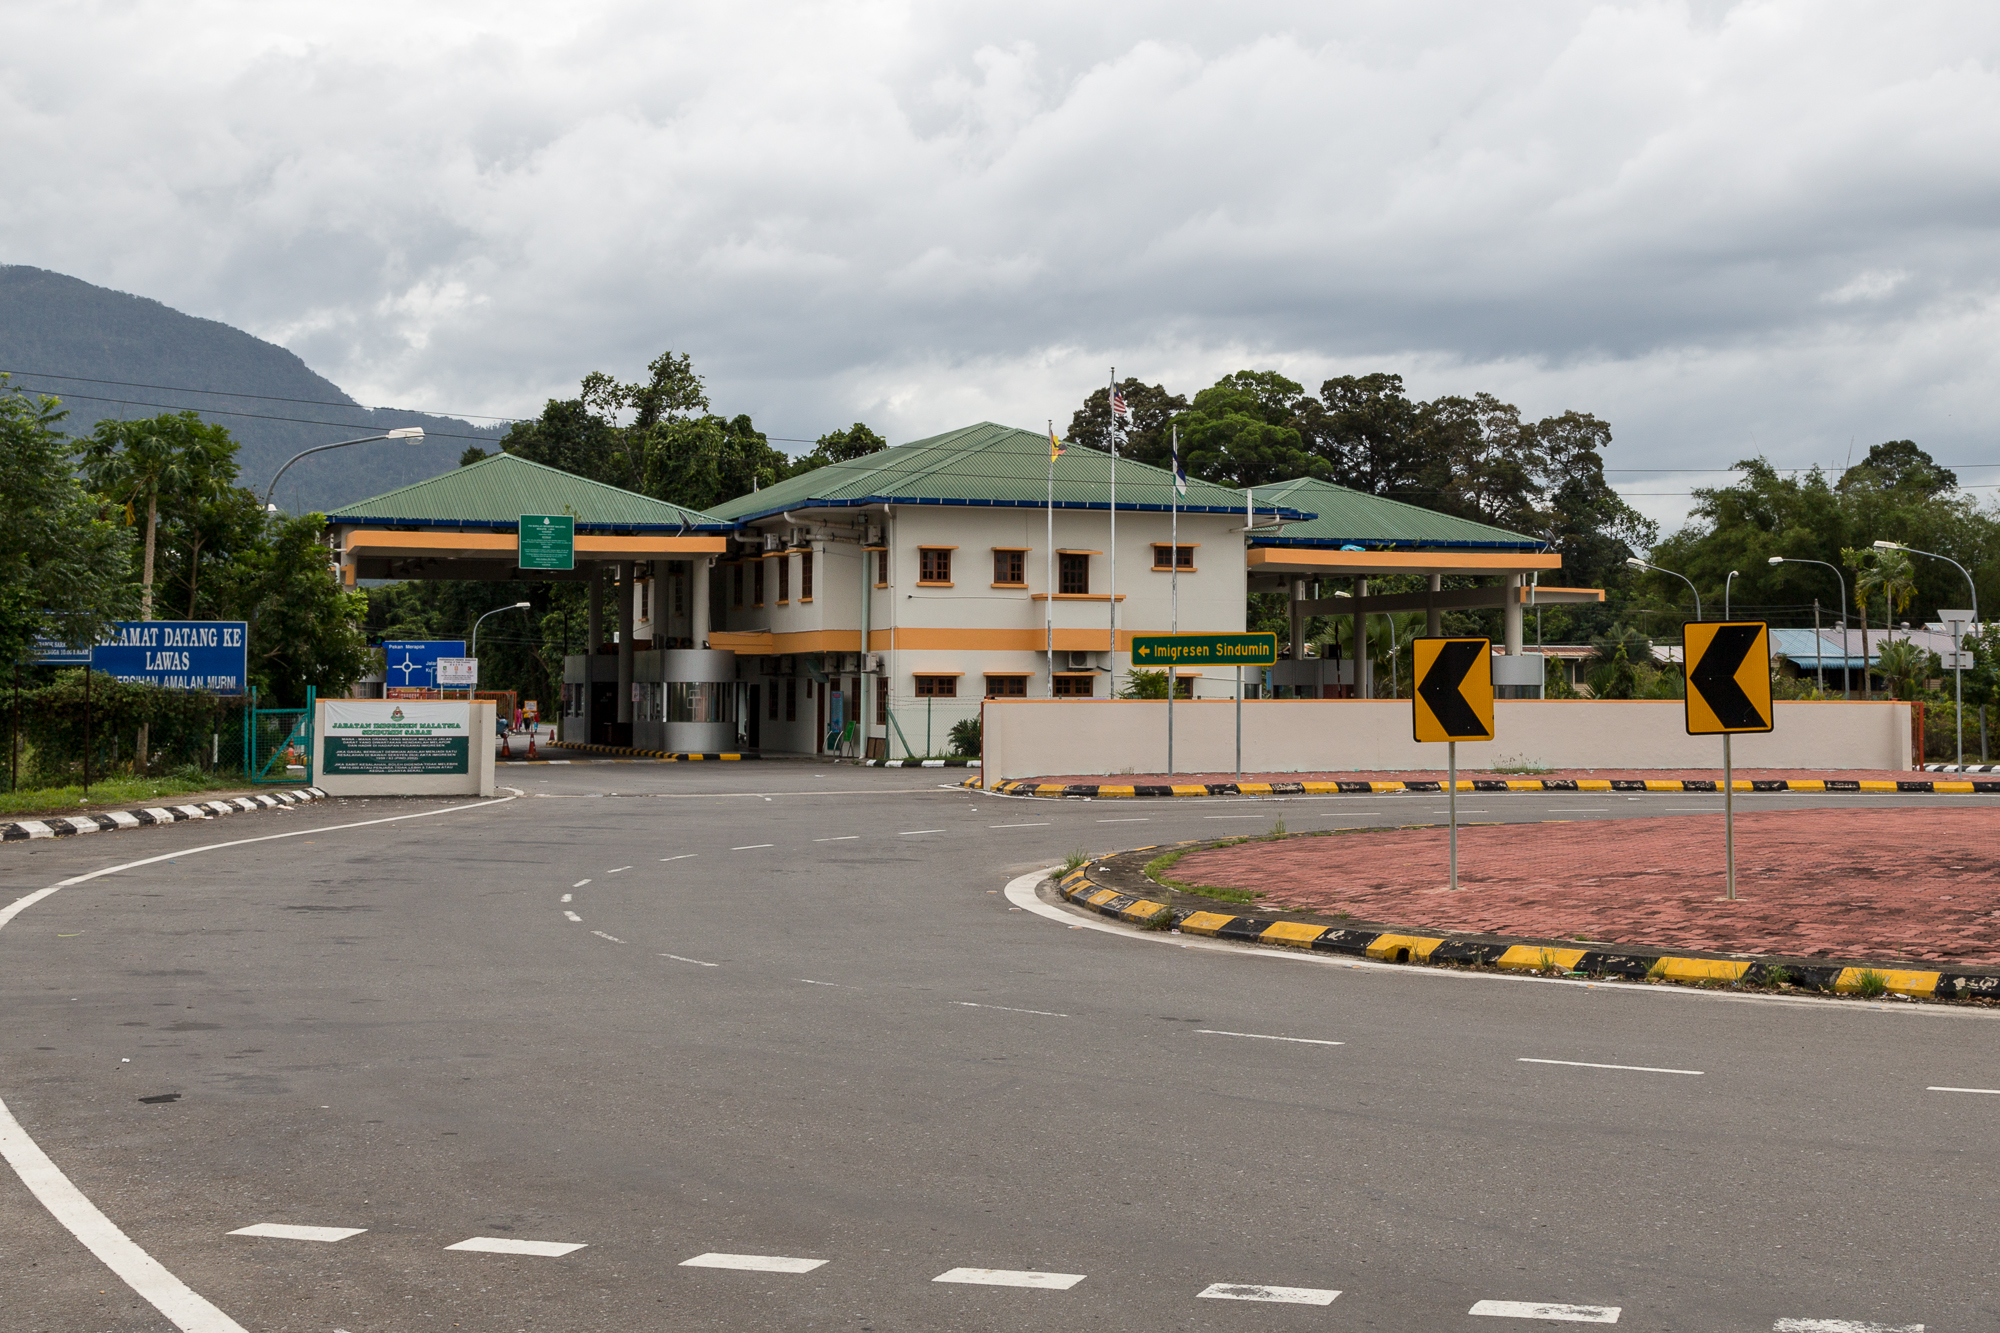
林梦(LIMBANG),是马来西亚砂拉越州北部的市镇,其東部与西部皆为文莱。文莱一直以来都没放弃过向马来西亚索回在该地区的主权。 ,林夢被夾於汶萊的東、西兩部份領土中間。若驅車從林夢到砂勞越的東西兩個方向之其他城市,都得經過汶萊,否則得應用崎嶇不平的木山道路。 。 ,兩國因錢幣差值關係,汶萊人常過境購買貨物,促成林夢商業極其發達。
林梦 Wikipedia頁面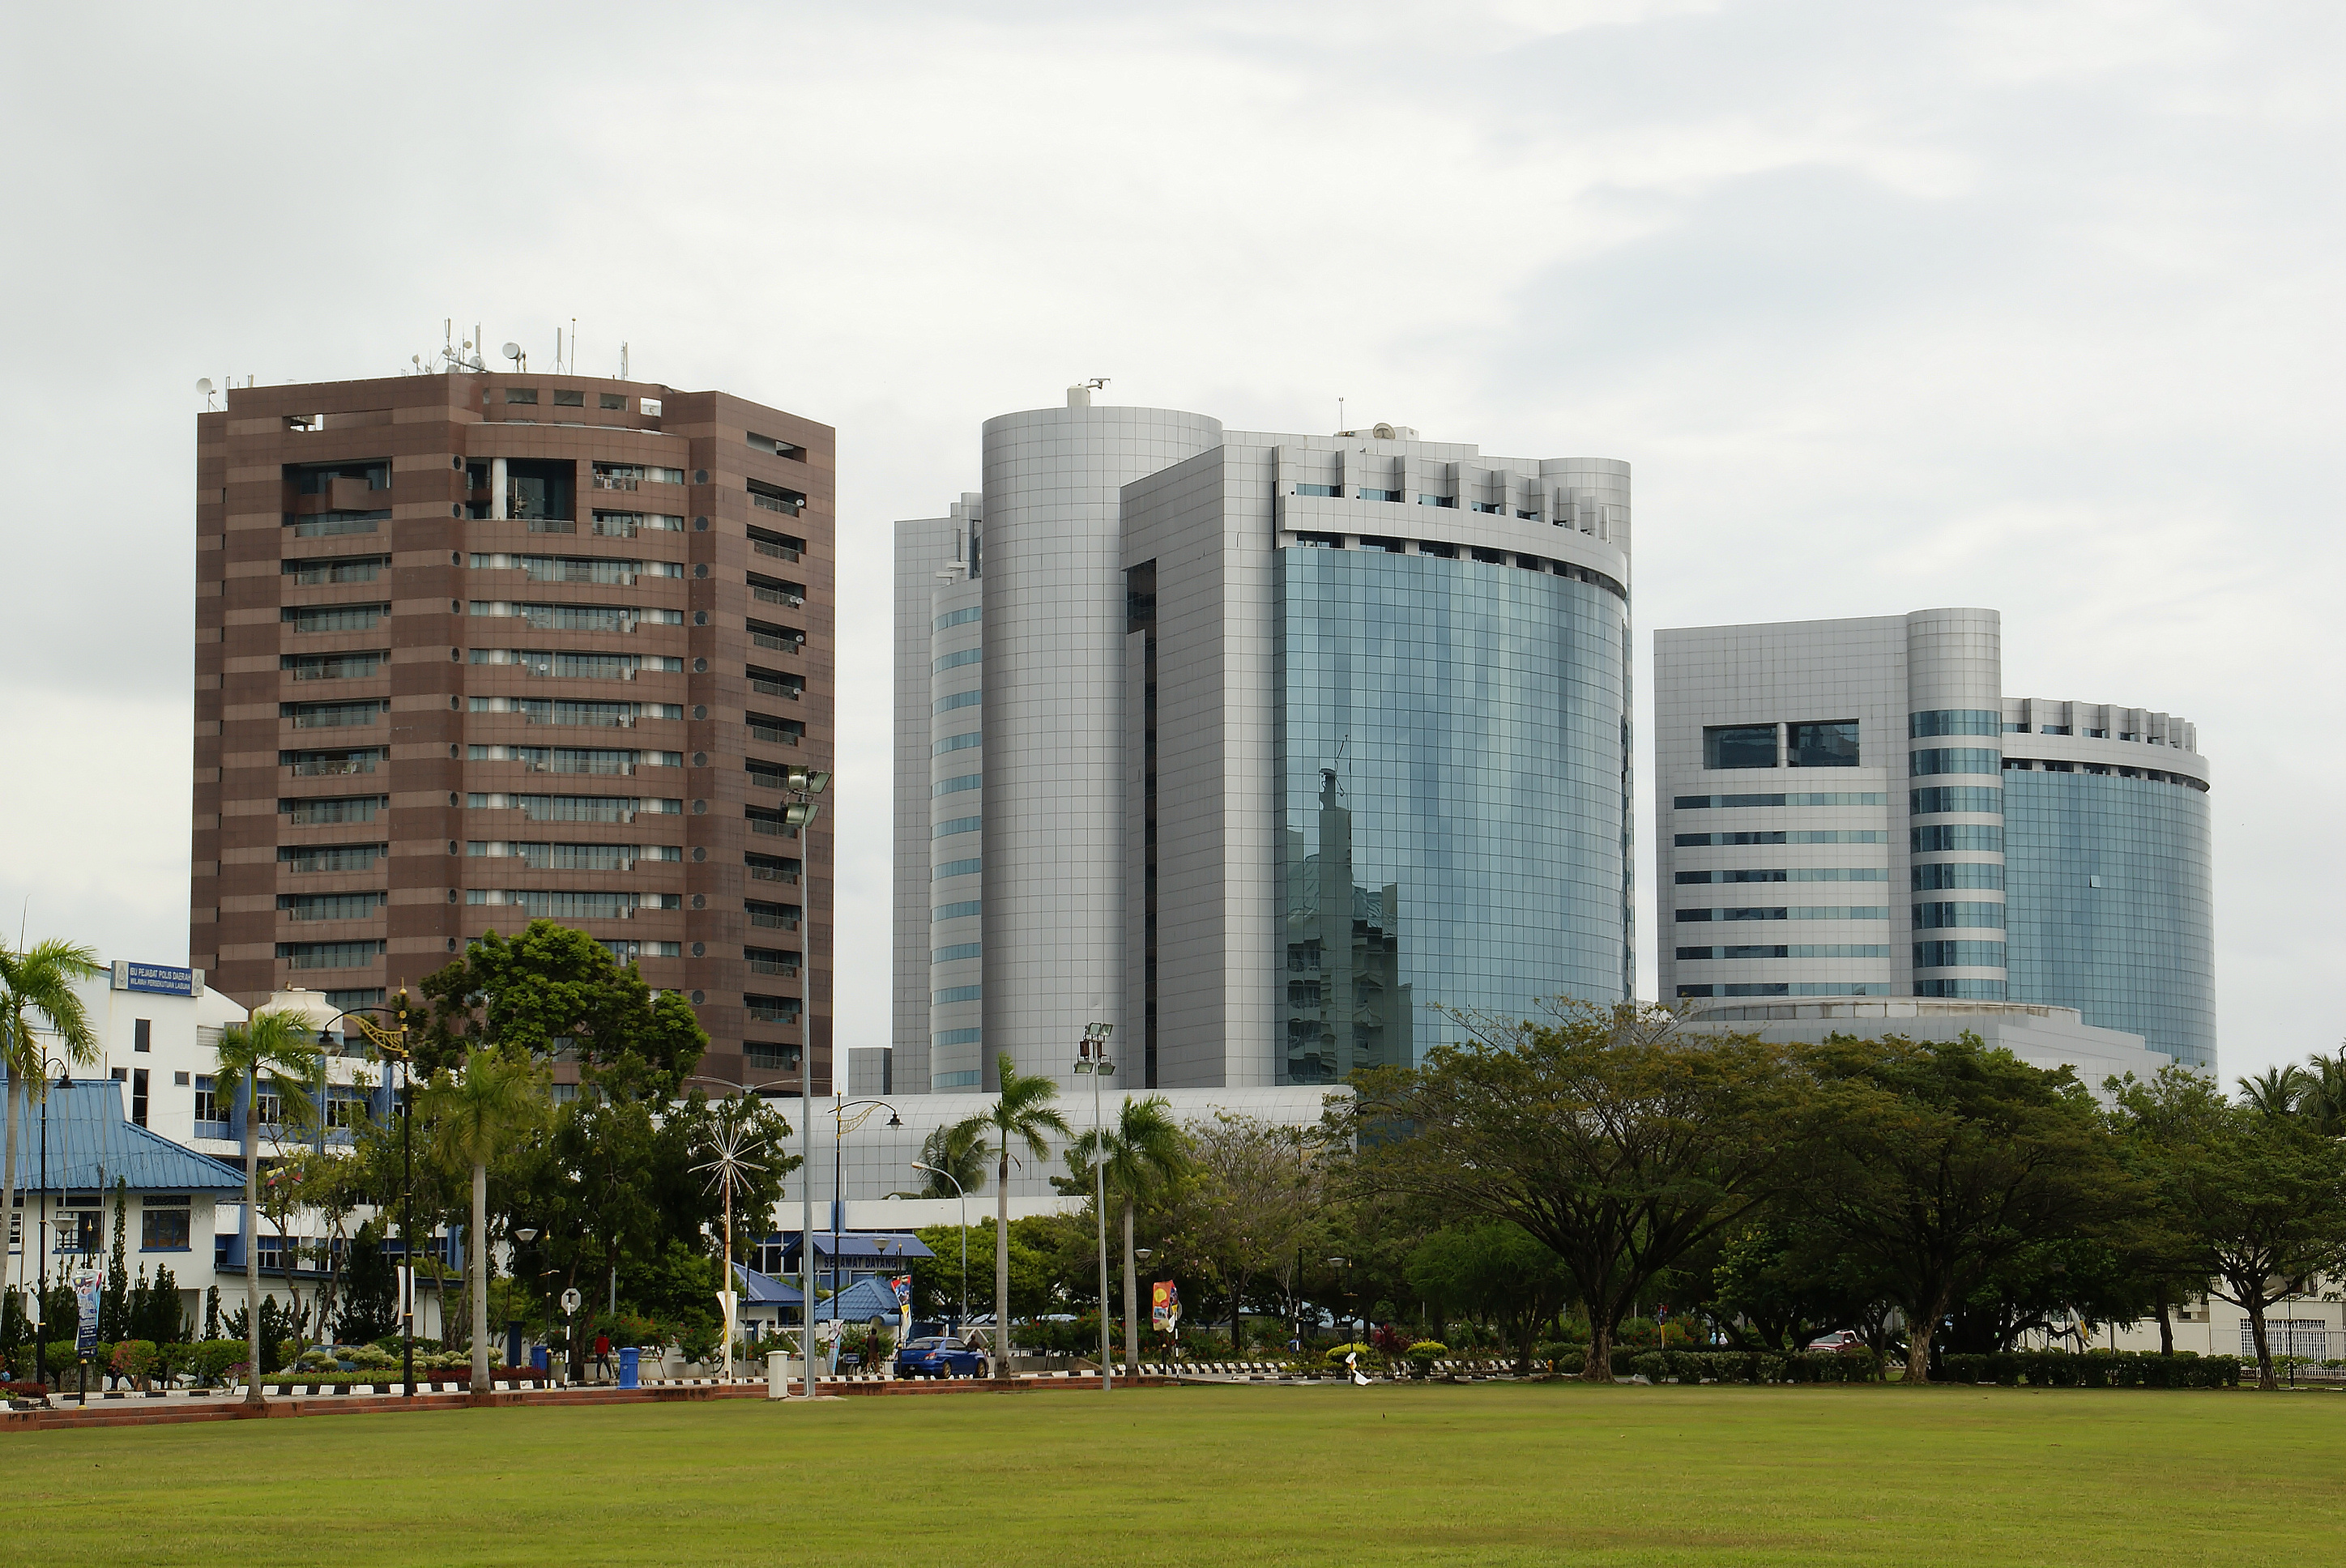

關於我們的數據
本页面上的数据是使用许多公开可用的工具和资源估算的。它不附带任何担保,可能包含不准确之处。使用风险自负。