Papalotla的类别
加油站技工汽车修理和保养汽车机械修理店汽车维修汽车配件城洗车手工艺品批发商服装和织物制造商清洁用品供应商瓶装水供应商金属加工铁匠面料批发商布店时尚配饰店服装店珠宝商和手表缝纫用品店鞋店手机店电信服务商回收中心地方政府机关天主教堂宗教宗教机构政府机构教堂社交俱樂部过滤厂数码城软件公司五金店家居用品商店建材商店楼宇的建筑油漆店教育教育机构职业与专业培训图文设计师艺术工作室冰淇淋店咖啡咖啡館塔可餐厅墨西哥餐馆天然食品店屠夫快餐店杂货店和超市比萨汉堡店海鲜餐馆烘焙坊烧烤吧甜品店糖果店网吧自助食堂蔬果店蛋糕店送餐服务酒馆和酒吧和小旅馆餐馆鸡肉餐馆家具店自行车修理苗圃和园艺用具自动取款机银行健康顾问内科门诊部医院牙科医生眼镜商和眼镜活动场所理发店纹身店美发沙龙美容院美甲和修脚企业对企业服务办公用品和文具店广告公司多功能厅私人屋苑综合公寓便利店商场新奇物品店礼品店纸张店综合商店花店藥店购物中心超市酒类商店体育俱乐部健身房公园汽车旅馆酒店旅馆无法访问
產業領域
Papalotla按行业的企业分布
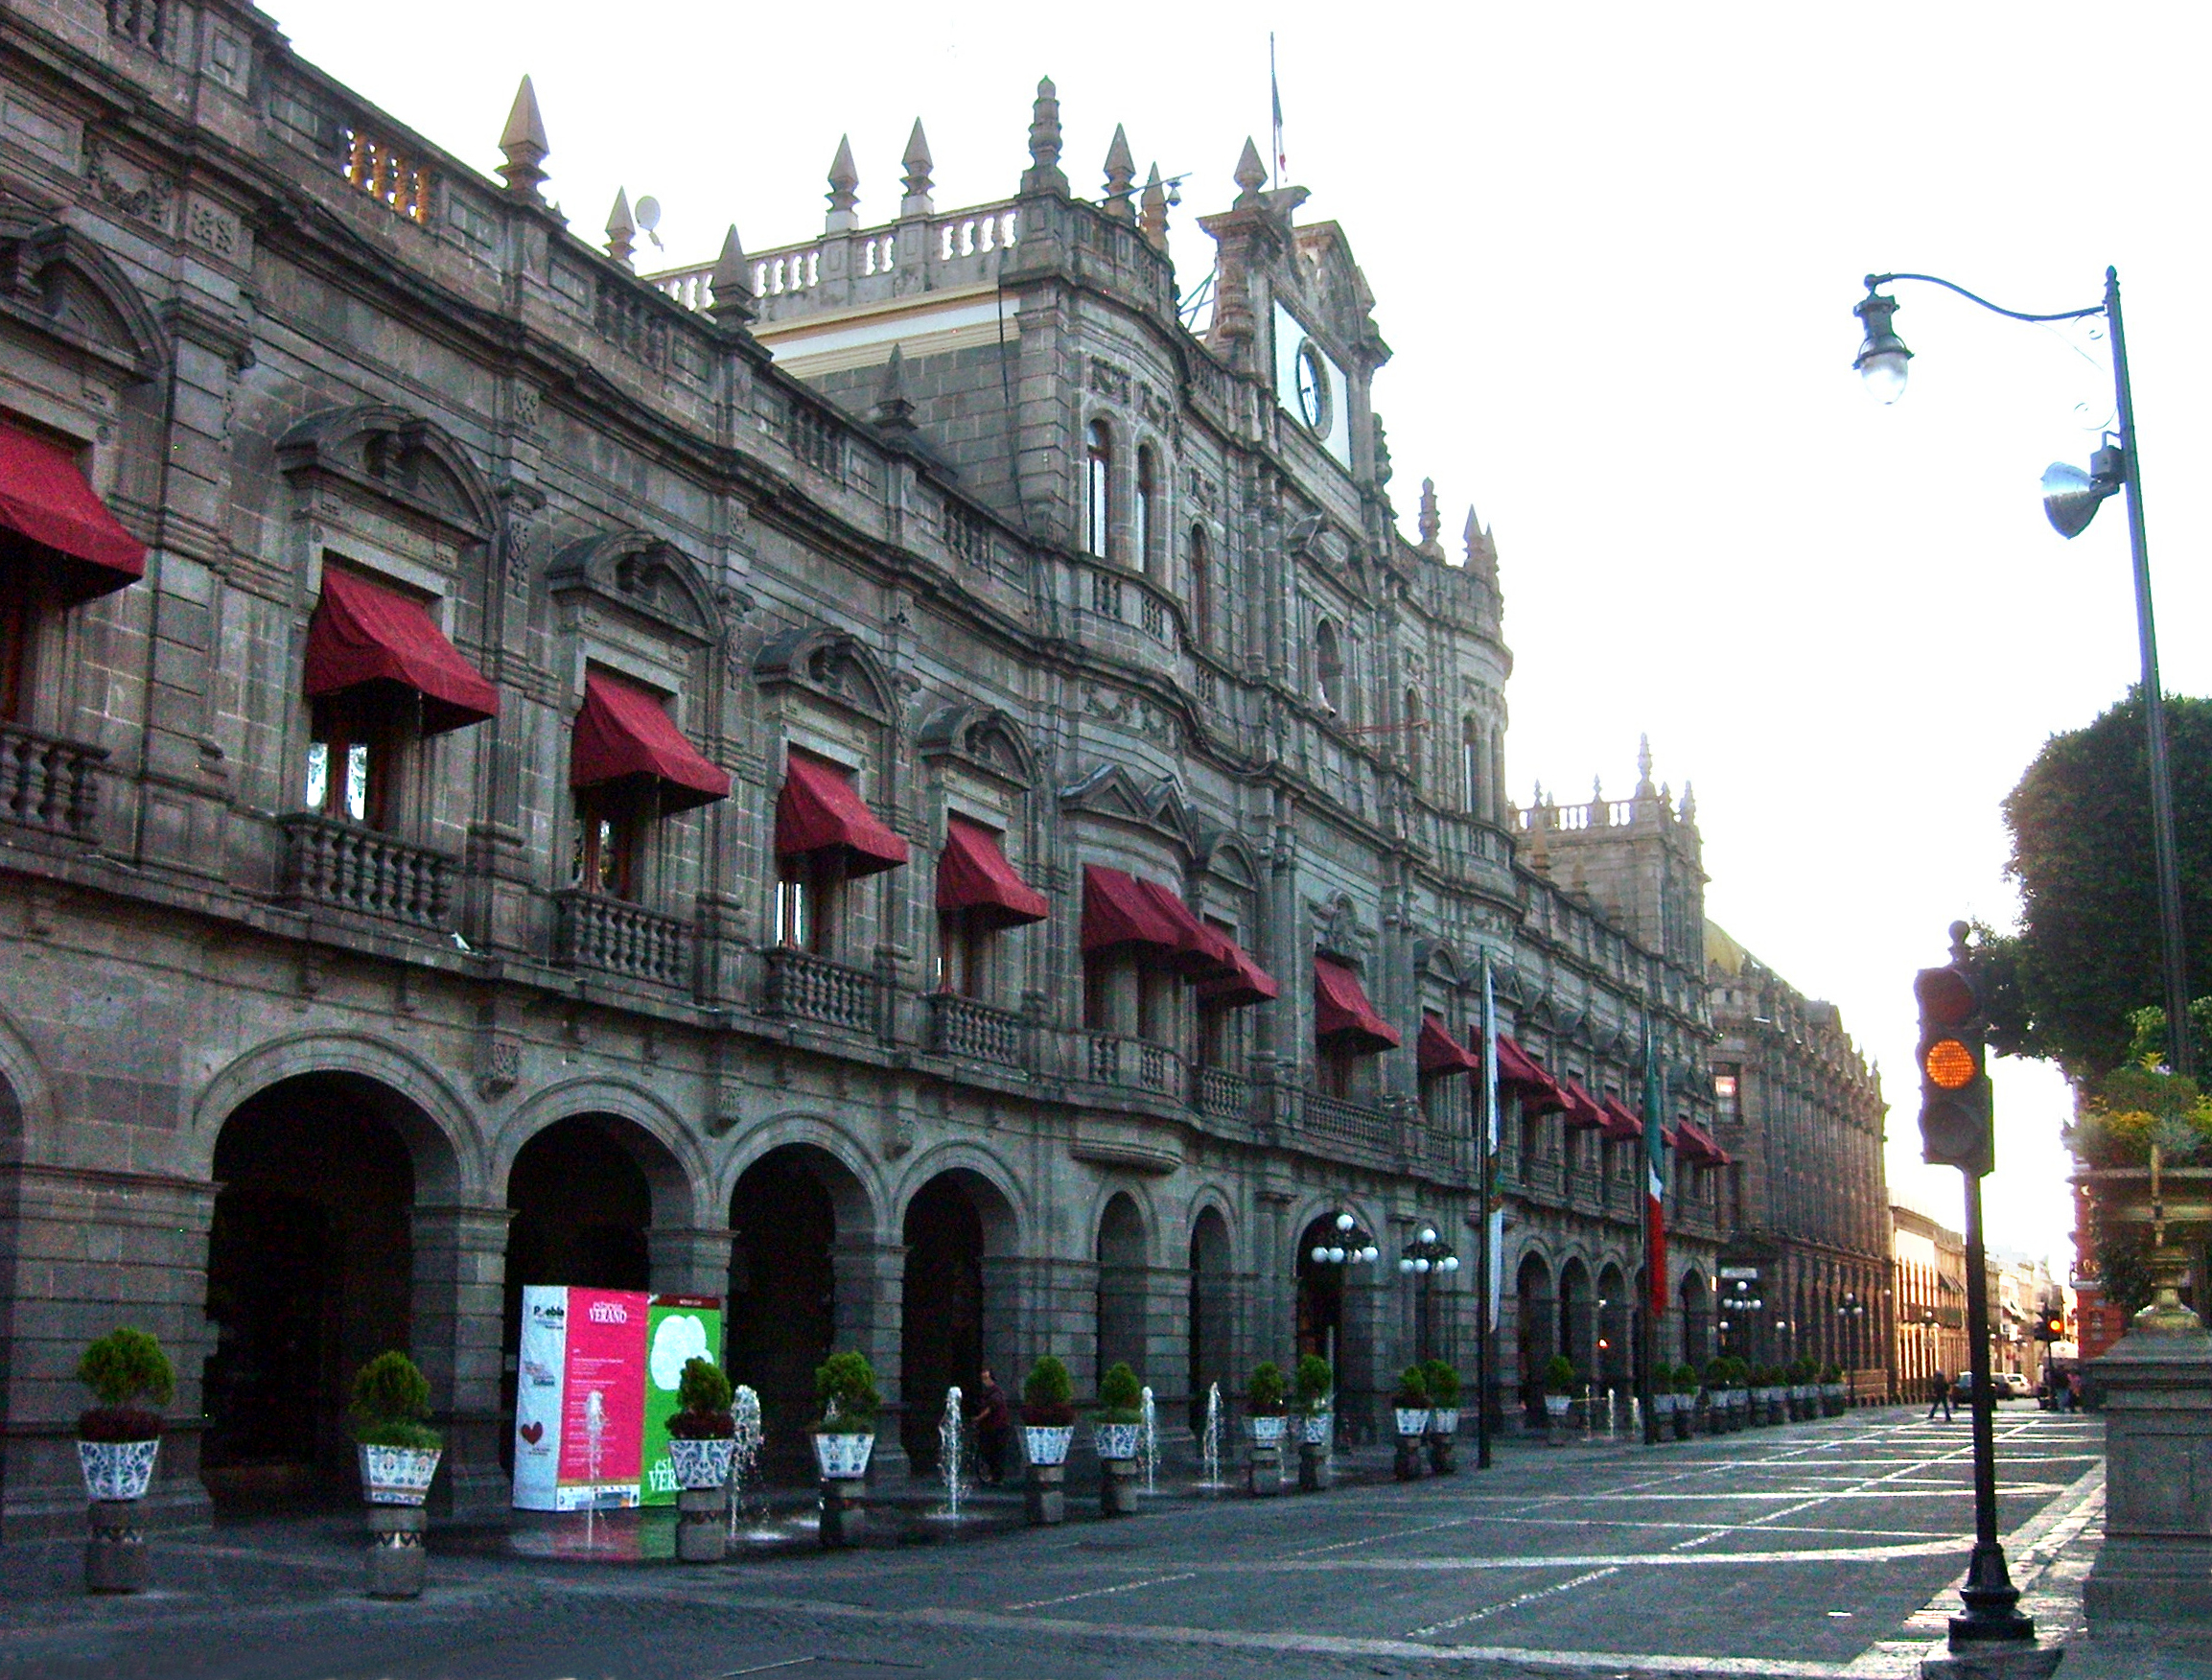
Papalotla的地圖
互動地圖
Papalotla的人口
1975年至2020年
| Data | 1975 | 1990 | 2000 | 2015 | 2020 |
|---|---|---|---|---|---|
| 人口 | 10,364 | 16,288 | 20,530 | 25,874 | 27,217 |
| 人口密度 | 767.7 / km² | 1,206.5 / km² | 1,520.7 / km² | 1,916.6 / km² | 2,016.1 / km² |
来源: JRC (European Commission's Joint Research Centre) 工作于 GHS built-up grid
Papalotla从2000年到2015年的人口变化
从2000年到2015年增长了26%
| 位置 | 自1975以来的变化 | 自1990以来的变化 | 自2000以来的变化 |
|---|---|---|---|
| Papalotla | +149.7% | +58.9% | +26% |
| 特拉斯卡拉州 | +140.5% | +56.7% | +25.5% |
| 墨西哥 | +108.7% | +48.4% | +23.5% |
来源: JRC (European Commission's Joint Research Centre) 工作于 GHS built-up grid
Papalotla的中位年龄
中位年龄:25.7岁
| 位置 | 年齡中位數 | 中位年齡(女) | 中位年齡(男) |
|---|---|---|---|
| Papalotla | 25.7 yrs | 26.6 yrs | 24.7 yrs |
| 特拉斯卡拉州 | 25 yrs | 26.1 yrs | 24 yrs |
| 墨西哥 | 26.2 yrs | 27 yrs | 25.3 yrs |
来源: CIESIN (Center for International Earth Science Information Network)
Papalotla的人口密度
人口密度:2,016 / km²
| 位置 | 人口 | 區 | 密度 |
|---|---|---|---|
| Papalotla | 27,217 | 13.5 km² | 2,016 / km² |
| 特拉斯卡拉州 | 1.3 million | 3,997.2 km² | 330 / km² |
| 墨西哥 | 126.8 million | 1,965,208 km² | 64.5 / km² |
来源: JRC (European Commission's Joint Research Centre) 工作于 GHS built-up grid
Papalotla的历史和预测人口
从200到2100的估计人口
来源:
- JRC (European Commission's Joint Research Centre) 工作于 GHS built-up grid
- CIESIN (Center for International Earth Science Information Network)
- [鏈接] Klein Goldewijk, K., Beusen, A., Doelman, J., and Stehfest, E.: Anthropogenic land use estimates for the Holocene – HYDE 3.2, Earth Syst. Sci. Data, 9, 927–953, https://doi.org/10.5194/essd-9-927-2017, 2017.
Papalotla的街区
Papalotla各街区企业占比
邮政编码
Papalotla各邮政编码企业占比
价格分布
Papalotla企業(按價格分佈)
人類發展指數(HDI)
預期壽命,教育程度和人均收入的統計綜合指數。
来源: [鏈接] Kummu, M., Taka, M. &Guillaume, J. Gridded global datasets for Gross Domestic Product and Human Development Index over 1990–2015. Sci Data 5, 180004 (2018) doi:10.1038/sdata.2018.4
Papalotla的CO2排放
每年人均二氧化碳(CO2)排放量(噸)
| 位置 | 二氧化碳排放量 | 人均二氧化碳排放量 | 二氧化碳排放強度 |
|---|---|---|---|
| Papalotla | 103,871 tn | 3.82 tn | 7,694.2 tons/km² |
| 特拉斯卡拉州 | 4,818,096 tn | 3.66 tn | 1,205.4 tons/km² |
| 墨西哥 | 496,865,013 tn | 3.92 tn | 252.8 tons/km² |
来源: [鏈接] Moran, D., Kanemoto K; Jiborn, M., Wood, R., Többen, J., and Seto, K.C. (2018) Carbon footprints of 13,000 cities. Environmental Research Letters DOI: 10.1088/1748-9326/aac72a
Papalotla的CO2排放
| 2013年CO2排放量(吨/年) | 103,871 tn |
| 2013年人均CO2排放量(吨/年) | 3.82 tn |
| 2013年CO2排放强度(吨/km²/年) | 7,694.2 tons/km² |
自然災害風險
Relative risk out of 10
| 危险 | Risk Level |
|---|---|
| Drought | Medium (4) |
| Flood | High (9) |
| Earthquake | Medium (4) |
* Risk, particularly concerning flood or landslide, may not be for the entire area.
来源:
- Dilley, M., R.S. Chen, U. Deichmann, A.L. Lerner-Lam, M. Arnold, J. Agwe, P. Buys, O. Kjekstad, B. Lyon, and G. Yetman. 2005. Natural Disaster Hotspots: A Global Risk Analysis. Washington, D.C.: World Bank. https://doi.org/10.1596/0-8213-5930-4.
- Center for Hazards and Risk Research - CHRR - Columbia University, Center for International Earth Science Information Network - CIESIN - Columbia University, and International Research Institute for Climate and Society - IRI - Columbia University. 2005. Global Drought Hazard Frequency and Distribution. Palisades, NY: NASA Socioeconomic Data and Applications Center (SEDAC). https://doi.org/10.7927/H4VX0DFT.
- Center for Hazards and Risk Research - CHRR - Columbia University, Center for International Earth Science Information Network - CIESIN - Columbia University. 2005. Global Flood Hazard Frequency and Distribution. Palisades, NY: NASA Socioeconomic Data and Applications Center (SEDAC). https://doi.org/10.7927/H4668B3D.
- Center for Hazards and Risk Research - CHRR - Columbia University, Center for International Earth Science Information Network - CIESIN - Columbia University. 2005. Global Earthquake Hazard Distribution - Peak Ground Acceleration. Palisades, NY: NASA Socioeconomic Data and Applications Center (SEDAC). https://doi.org/10.7927/H4BZ63ZS.
最近的附近地震
幅度3.0以上
| 日▼ | 時間↕ | Magnitude↕ | Distance↕ | 深度↕ | 位置↕ | 鏈接 |
|---|---|---|---|---|---|---|
| 9/19/17 | 6:14 PM | 7.1 | 74.8 km | 48,000 m | 1km E of Ayutla, Mexico | usgs.gov |
| 6/21/13 | 9:41 AM | 4 | 90.4 km | 2,000 m | Morelos, Mexico | usgs.gov |
| 5/6/13 | 8:33 AM | 4.1 | 47.9 km | 1,000 m | Puebla, Mexico | usgs.gov |
| 12/13/08 | 1:43 AM | 3.2 | 75.1 km | 2,100 m | Estado de Mexico, Mexico | usgs.gov |
| 10/5/08 | 1:40 AM | 3.2 | 75 km | 2,000 m | Morelos, Mexico | usgs.gov |
| 8/12/08 | 11:29 PM | 3.8 | 22.3 km | 3,000 m | Tlaxcala, Mexico | usgs.gov |
| 8/9/08 | 2:59 AM | 3.4 | 28 km | 5,000 m | Tlaxcala, Mexico | usgs.gov |
| 11/10/07 | 5:50 AM | 3.4 | 85.1 km | 2,000 m | Puebla, Mexico | usgs.gov |
| 6/20/07 | 6:13 AM | 3.7 | 72.5 km | 1,500 m | Morelos, Mexico | usgs.gov |
| 12/14/06 | 9:25 PM | 3.8 | 50.3 km | 20,000 m | Tlaxcala, Mexico | usgs.gov |

關於我們的數據
本页面上的数据是使用许多公开可用的工具和资源估算的。它不附带任何担保,可能包含不准确之处。使用风险自负。