- 世界
- »
- ID
- »
- 巴厘岛
- »
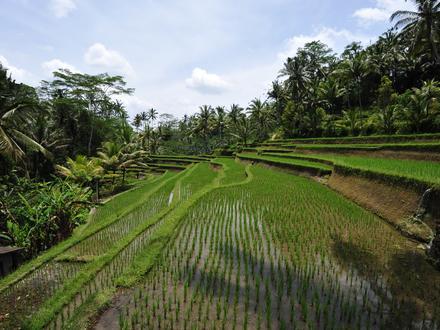
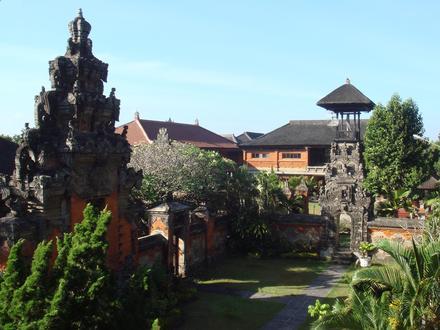
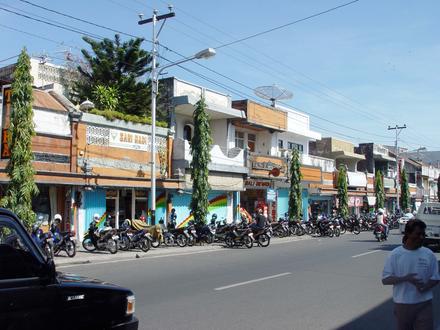
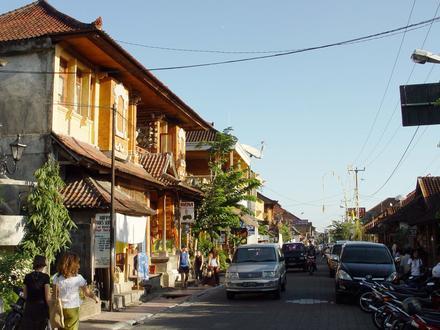
- Kintamani, 巴厘岛
在Kintamani的企业
产业领域
行业分布 酒店与旅游: 23.6%
餐馆: 19.3%
商场: 13.1%
宗教: 7.6%
教育: 5.1%
其他: 31.2%
| Kintamani, 巴厘岛地区 | 89.6平方公里 |
| 人口 | 66135 |
| 男性人口 | 33507 (50.7%) |
| 女性人口 | 32628 (49.3%) |
| 从1975到2015的人口变化 | +78.2% |
| 从2000到2015的人口变化 | +11.3% |
| 年龄中位数 | 31.4 |
| 男性平均年龄 | 31 |
| 女性平均年龄 | 31.8 |
| 电话区号 | 36 |
| 邻近社区 | Batur Selatan, Kintamani, Central Batur, Kintamani, Katung, Kintamani, Kedisan, Kintamani, Kintamani, North Batur, Kintamani, Songan B, Kintamani, South Batur, Kintamani |
| 本地时间 | 星期四 21:09 |
| 时区 | 印度尼西亚中部时间 |
| 經度與緯度 | -8.2443° / 115.3276° |
| 邮政编码 | 80652 |
Kintamani, 巴厘岛 -地图
Kintamani, 巴厘岛人口
1975年到2015年| 数据 | 1975 | 1990 | 2000 | 2015 |
|---|---|---|---|---|
| 人口 | 37112 | 53359 | 59419 | 66135 |
| 人口密度 | 414.4 / km² | 595.8 / km² | 663.5 / km² | 738.5 / km² |
Kintamani从2000到2015的人口变化
从2000年到2015年增长11.3%| 位置 | 1975以来的变化 | 1990以来的变化 | 2000以来的变化 |
|---|---|---|---|
| Kintamani, 巴厘岛 | +78.2% | +23.9% | +11.3% |
| 巴厘岛 | +146.8% | +63.5% | +32.6% |
| 印度尼西亚 | +96.9% | +41.9% | +21.7% |
Kintamani, 巴厘岛平均年龄
平均年龄:31.4年| 位置 | 年龄中位数 | 中位年龄(女) | 中位年龄(男) |
|---|---|---|---|
| Kintamani, 巴厘岛 | 31.4年 | 31.8年 | 31年 |
| 巴厘岛 | 30.5年 | 31年 | 30.1年 |
| 印度尼西亚 | 27.2年 | 27.5年 | 26.9年 |
Kintamani, 巴厘岛人口树形图
年龄和性别的人口| 年龄 | 男性 | 女性 | 总 |
|---|---|---|---|
| 5岁以下 | 2966 | 2751 | 5718 |
| 5-9 | 3106 | 2897 | 6004 |
| 10-14 | 2994 | 2855 | 5849 |
| 15-19 | 2437 | 2108 | 4545 |
| 20-24 | 2044 | 2036 | 4081 |
| 25-29 | 2670 | 2668 | 5338 |
| 30-34 | 2772 | 2702 | 5474 |
| 35-39 | 2921 | 2819 | 5741 |
| 40-44 | 2255 | 2284 | 4540 |
| 45-49 | 2028 | 2039 | 4067 |
| 50-54 | 1791 | 1902 | 3693 |
| 55-59 | 1478 | 1415 | 2893 |
| 60-64 | 1209 | 1255 | 2464 |
| 65-69 | 1035 | 1031 | 2066 |
| 70-74 | 799 | 838 | 1637 |
| 75-79 | 467 | 511 | 978 |
| 80-84 | 342 | 328 | 671 |
| 85加 | 194 | 190 | 384 |
Kintamani, 巴厘岛人口密度
人口密度: 738.5 / km²| 位置 | 人口 | 面积 | 人口密度 |
|---|---|---|---|
| Kintamani, 巴厘岛 | 66135 | 89.6平方公里 | 738.5 / km² |
| 巴厘岛 | 4.3 million | 5,653.8平方公里 | 758.5 / km² |
| 印度尼西亚 | 252.8 million | 1,893,657.8平方公里 | 133.5 / km² |
Kintamani, 巴厘岛的历史和预计人口
从1000到2100的估计人口Sources:
1. JRC (European Commission's Joint Research Centre) work on the GHS built-up grid
2. CIESIN (Center for International Earth Science Information Network)
3. [链接] Klein Goldewijk, K., Beusen, A., Doelman, J., and Stehfest, E.: Anthropogenic land use estimates for the Holocene – HYDE 3.2, Earth Syst. Sci. Data, 9, 927–953, https://doi.org/10.5194/essd-9-927-2017, 2017.
邻近社区
Kintamani企业(按街区分布) Kedisan, Kintamani: 13.8%
Kintamani: 12.1%
Batur Selatan, Kintamani: 8.6%
Central Batur, Kintamani: 8.6%
Katung, Kintamani: 5.2%
Songan B, Kintamani: 5.2%
North Batur, Kintamani: 5.2%
South Batur, Kintamani: 5.2%
Toya Bungkah: 3.4%
Batudinding, Kintamani: 3.4%
Batur Tengah, Kintamani: 3.4%
其他: 25.9%
区号
Kintamani的企业使用的区号百分比 电话区号 8: 70.2%
电话区号 36: 26.3%
其他: 3.5%
Kintamani, 巴厘岛企业(按价格分布)
适中: 82.6%
不贵: 12.8%
贵: 4.6%
人类发展指数(HDI)
预期寿命,教育程度和人均收入的统计综合指数。Sources: [Link] Kummu, M., Taka, M. & Guillaume, J. Gridded global datasets for Gross Domestic Product and Human Development Index over 1990–2015. Sci Data 5, 180004 (2018) doi:10.1038/sdata.2018.4
Kintamani, 巴厘岛二氧化碳排放
每年人均二氧化碳(CO2)排放量(吨)| 位置 | 二氧化碳排放量 | 人均二氧化碳排放量 | 二氧化碳排放强度 |
|---|---|---|---|
| Kintamani, 巴厘岛 | 146,877 tn | 2.22 tn | 1,640 tn/km² |
| 巴厘岛 | 8,769,218 tn | 2.05 tn | 1,551 tn/km² |
| 印度尼西亚 | 478,610,416 tn | 1.89 tn | 252.7 tn/km² |
Kintamani, 巴厘岛二氧化碳排放
| 2013年二氧化碳排放量(吨/年) | 146,877 tn |
| 2013人均二氧化碳排放量(吨/年) | 2.22 tn |
| 2013二氧化碳排放强度(吨/平方公里/年) | 1,640 tn/km² |
自然灾害风险
相对风险(满分10分)| 滑坡 | 高(9) |
| 火山 | 高(7) |
| 地震 | 平均值(5.8) |
*风险可能并不涉及整个地区,尤其是洪水或山体滑坡。
Sources: 1. Dilley, M., R.S. Chen, U. Deichmann, A.L. Lerner-Lam, M. Arnold, J. Agwe, P. Buys, O. Kjekstad, B. Lyon, and G. Yetman. 2005. Natural Disaster Hotspots: A Global Risk Analysis. Washington, D.C.: World Bank. https://doi.org/10.1596/0-8213-5930-4.
2. Center for Hazards and Risk Research - CHRR - Columbia University, Center for International Earth Science Information Network - CIESIN - Columbia University. 2005. Global Earthquake Hazard Distribution - Peak Ground Acceleration. Palisades, NY: NASA Socioeconomic Data and Applications Center (SEDAC). https://doi.org/10.7927/H4BZ63ZS.
3. Center for Hazards and Risk Research - CHRR - Columbia University, Center for International Earth Science Information Network - CIESIN - Columbia University, and Norwegian Geotechnical Institute - NGI. 2005. Global Landslide Hazard Distribution. Palisades, NY: NASA Socioeconomic Data and Applications Center (SEDAC). https://doi.org/10.7927/H4P848VZ.
4. Center for Hazards and Risk Research - CHRR - Columbia University, Center for International Earth Science Information Network - CIESIN - Columbia University. 2005. Global Volcano Hazard Frequency and Distribution. Palisades, NY: NASA Socioeconomic Data and Applications Center (SEDAC). https://doi.org/10.7927/H4BR8Q45.
最近的附近地震
幅度3.0以上| 日期 | 时间 | 大小 | 距离 | 深度 | 位置 | 链接 |
|---|---|---|---|---|---|---|
| 2018/3/2 | 18:52 | 3.9 | 18.7公里 | 10,000米 | 7km WSW of Banjar Dukuh, Indonesia | usgs.gov |
| 2017/11/16 | 09:58 | 4.1 | 40.5公里 | 117,020米 | 0km ESE of Banjar Jabejero, Indonesia | usgs.gov |
| 2017/11/8 | 13:54 | 4.9 | 23.1公里 | 22,710米 | 3km SW of Banjar Dukuh, Indonesia | usgs.gov |
| 2017/9/26 | 01:27 | 4 | 17.8公里 | 7,770米 | 7km ESE of Banjar Bias, Indonesia | usgs.gov |
| 2017/8/22 | 01:02 | 4.1 | 24.1公里 | 169,060米 | 2km NNW of Tua, Indonesia | usgs.gov |
| 2017/3/21 | 16:40 | 4 | 16.4公里 | 115,200米 | 1km E of Banjar Tiga, Indonesia | usgs.gov |
| 2017/3/21 | 16:10 | 5.6 | 27.3公里 | 111,710米 | 1km SE of Banjar Mulung, Indonesia | usgs.gov |
| 2016/8/9 | 08:37 | 4.3 | 38.8公里 | 18,510米 | 1km NNE of Tibulakasasak, Indonesia | usgs.gov |
| 2016/6/11 | 03:07 | 4.6 | 37.3公里 | 212,180米 | 16km NNE of Banjar Tambaksari, Indonesia | usgs.gov |
| 2016/2/8 | 07:19 | 4.1 | 35.2公里 | 17,690米 | 1km ESE of Banjar Kangkaang, Indonesia | usgs.gov |
查找Kintamani, 巴厘岛附近的历史地震事件
最早日期 最新日期
幅度3.0以上 幅度4.0及更高 震级5.0以上
关于我们的数据
此页面上的数据是使用许多公共可用工具和资源估算的。它不提供任何保修,并且可能包含不正确的地方。使用风险自负。有关更多信息,请参见此处 。