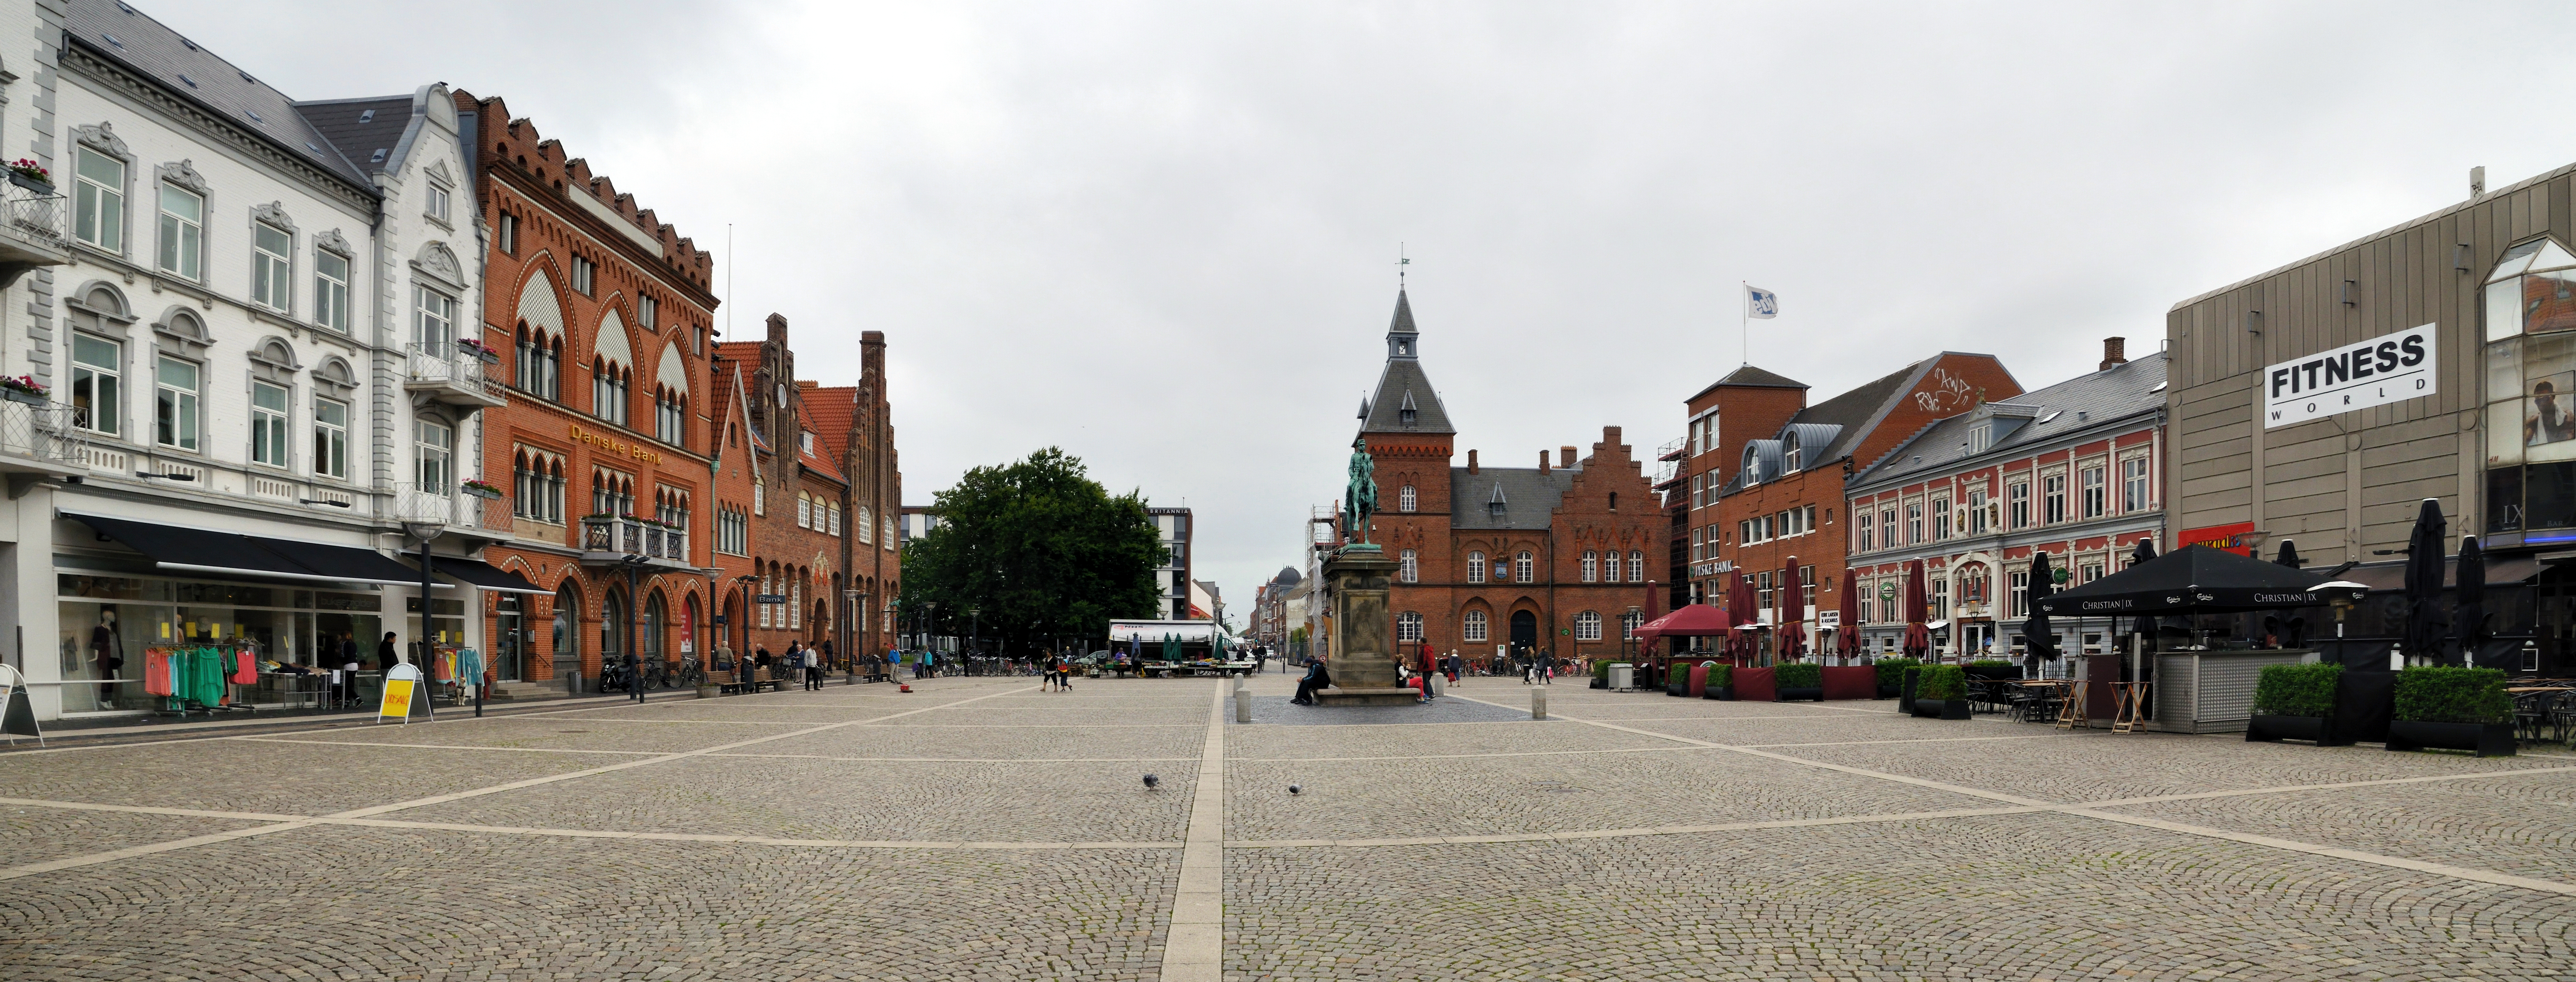
Tarm的类别
加油站新车经销商汽车修理和保养汽车维修汽车配件城伐木承包商农业奶牛场机械批发服装店Homeowners Association专业与兴趣协会人权协会协会或组织宗教机构宗教组织政党政府机构政治组织教堂文化协会日托中心货运和邮递服务一般承包商工程咨询办公室建材商店建筑师承包商木匠水泥匠油漆与油漆承包商泥瓦匠管道安装和维修教育驾驶学校博物馆国家森林杂货店和超市比萨餐馆园艺师控股公司银行公墓医院科室心理醫生替代药物物理治疗按摩理发师美发沙龙美容院专业会员组织商业清洁服务商务管理顾问窗户清洁服务管理咨询公司住宅物业租赁房地产中介非住宅租赁代理二手店商场批发商店花店超市体育俱乐部体育协会体育和休闲公园冒险与户外活动游乐场公交车站电动汽车充电站货运公司货运/商业运输酒店酒店旅馆无法访问
產業領域
Tarm按行业的企业分布
| 行業說明 | 機構數 | Google平均評分 |
|---|---|---|
| 无法访问 | 52 | 3.7 |
| 商场 | 45 | 4.3 |
| 所有会员组织 | 28 | 4.1 |
| 园林绿化 | 27 | 4.8 |
| 控股公司 | 26 | 5 |
| 农业 | 25 | 4.8 |
| 其他会员组织 | 24 | 3.3 |
| 股票经纪 | 23 | 5 |
| 购物 - 其他 | 19 | 4.4 |
| 金融服务 | 18 | — |
| 餐馆 | 17 | 4.1 |
| 一般承包商 | 16 | 4.4 |
| 教育 | 14 | 4.3 |
| 汽车维修 | 13 | 4.8 |
| 所有食品和饮料 | 12 | 4.3 |
| 房地产 | 12 | 4 |
| 杂货店和超市 | 11 | 4.3 |
| 技术架构服务 | 10 | 5 |
| 体育和休闲 | 10 | 4.3 |
| 汽车部件 | 10 | 4.7 |
| 苗圃和园艺用具 | 9 | 4.9 |
| 建筑材料批发 | 8 | 4.3 |
| 美容院 | 8 | 4.8 |
| 机械设备批发 | 8 | 4.3 |
| 厨柜和浴室柜装修 | 8 | 1 |
顯示1-25,共27
Tarm事实
| 區 | 3.4 km² |
| 人口 | 3,803 |
| 男性人口 | 1,877 (49.4%) |
| 女性人口 | 1,926 (50.6%) |
| 人口变化(1975 to 2020) | +11.9% |
| 人口变化(2000 to 2020) | +2.6% |
| 年齡中位數 | 46.4岁 (男:44.7,女:48.1) |
| 鄰近社區 | Bork Havn |
| 當地時間 | |
| 時區 | 中欧夏令时间 |
| 經度與緯度 | 55.90861, 8.53041 |
| 邮政编码 | 6880 |
Tarm的地圖
互動地圖
Tarm的人口
1975年至2020年
| Data | 1975 | 1990 | 2000 | 2015 | 2020 |
|---|---|---|---|---|---|
| 人口 | 3,400 | 3,615 | 3,707 | 3,720 | 3,803 |
| 人口密度 | 989.1 / km² | 1,051.6 / km² | 1,078.4 / km² | 1,082.2 / km² | 1,106.3 / km² |
来源: JRC (European Commission's Joint Research Centre) 工作于 GHS built-up grid
Tarm从2000年到2015年的人口变化
从2000年到2015年增长了0.4%
| 位置 | 自1975以来的变化 | 自1990以来的变化 | 自2000以来的变化 |
|---|---|---|---|
| Tarm | +9.4% | +2.9% | +0.4% |
| 中日德兰大区 | +4.3% | +11.5% | +7.5% |
| 丹麦 | +12.1% | +10.4% | +6.3% |
来源: JRC (European Commission's Joint Research Centre) 工作于 GHS built-up grid
Tarm的中位年龄
中位年龄:46.4岁
| 位置 | 年齡中位數 | 中位年齡(女) | 中位年齡(男) |
|---|---|---|---|
| Tarm | 46.4 yrs | 48.1 yrs | 44.7 yrs |
| 中日德兰大区 | 39.6 yrs | 40.3 yrs | 38.8 yrs |
| 丹麦 | 40.5 yrs | 41.3 yrs | 39.6 yrs |
来源: CIESIN (Center for International Earth Science Information Network)
Tarm的人口密度
人口密度:1,106 / km²
| 位置 | 人口 | 區 | 密度 |
|---|---|---|---|
| Tarm | 3,803 | 3.438 km² | 1,106 / km² |
| 中日德兰大区 | 1.3 million | 13,192.2 km² | 96.2 / km² |
| 丹麦 | 5.5 million | 43,072 km² | 129 / km² |
来源: JRC (European Commission's Joint Research Centre) 工作于 GHS built-up grid
Tarm的历史和预测人口
从0到2100的估计人口
来源:
- JRC (European Commission's Joint Research Centre) 工作于 GHS built-up grid
- CIESIN (Center for International Earth Science Information Network)
- [鏈接] Klein Goldewijk, K., Beusen, A., Doelman, J., and Stehfest, E.: Anthropogenic land use estimates for the Holocene – HYDE 3.2, Earth Syst. Sci. Data, 9, 927–953, https://doi.org/10.5194/essd-9-927-2017, 2017.
价格分布
Tarm企業(按價格分佈)
人類發展指數(HDI)
預期壽命,教育程度和人均收入的統計綜合指數。
来源: [鏈接] Kummu, M., Taka, M. &Guillaume, J. Gridded global datasets for Gross Domestic Product and Human Development Index over 1990–2015. Sci Data 5, 180004 (2018) doi:10.1038/sdata.2018.4
Tarm的CO2排放
每年人均二氧化碳(CO2)排放量(噸)
| 位置 | 二氧化碳排放量 | 人均二氧化碳排放量 | 二氧化碳排放強度 |
|---|---|---|---|
| Tarm | 39,567 tn | 10.4 tn | 11,510.4 tons/km² |
| 中日德兰大区 | 13,156,967 tn | 10.36 tn | 997.3 tons/km² |
| 丹麦 | 59,647,725 tn | 10.75 tn | 1,384.8 tons/km² |
来源: [鏈接] Moran, D., Kanemoto K; Jiborn, M., Wood, R., Többen, J., and Seto, K.C. (2018) Carbon footprints of 13,000 cities. Environmental Research Letters DOI: 10.1088/1748-9326/aac72a
Tarm的CO2排放
| 2013年CO2排放量(吨/年) | 39,567 tn |
| 2013年人均CO2排放量(吨/年) | 10.4 tn |
| 2013年CO2排放强度(吨/km²/年) | 11,510.4 tons/km² |
自然災害風險
Relative risk out of 10
| 危险 | Risk Level |
|---|---|
| Drought | Low (2) |
* Risk, particularly concerning flood or landslide, may not be for the entire area.
来源:
- Dilley, M., R.S. Chen, U. Deichmann, A.L. Lerner-Lam, M. Arnold, J. Agwe, P. Buys, O. Kjekstad, B. Lyon, and G. Yetman. 2005. Natural Disaster Hotspots: A Global Risk Analysis. Washington, D.C.: World Bank. https://doi.org/10.1596/0-8213-5930-4.
- Center for Hazards and Risk Research - CHRR - Columbia University, Center for International Earth Science Information Network - CIESIN - Columbia University, and International Research Institute for Climate and Society - IRI - Columbia University. 2005. Global Drought Hazard Frequency and Distribution. Palisades, NY: NASA Socioeconomic Data and Applications Center (SEDAC). https://doi.org/10.7927/H4VX0DFT.
最近的附近地震
幅度3.0以上
| 日▼ | 時間↕ | Magnitude↕ | Distance↕ | 深度↕ | 位置↕ | 鏈接 |
|---|---|---|---|---|---|---|
| 9/16/18 | 8:57 AM | 3.8 | 62.8 km | 10,000 m | 23km NW of Ulfborg, Denmark | usgs.gov |

關於我們的數據
本页面上的数据是使用许多公开可用的工具和资源估算的。它不附带任何担保,可能包含不准确之处。使用风险自负。